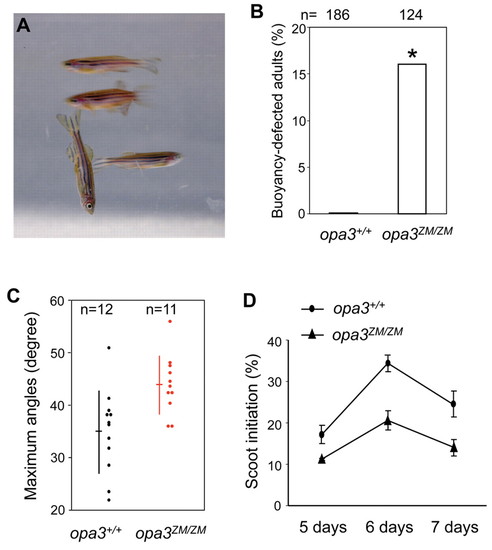
Behavioral anomalies of opa3ZM/ZM mutants. (A) Image of one abnormally swimming opa3ZM/ZM adult fish and three normal opa3ZM/ZM siblings. (B) Increased buoyancy in opa3ZM/ZM adult fish. Asterisk (*) indicates the statistical significance of the increase (chi-square test, P=2.1e–7). (C) Exaggerated vertical turns by opa3ZM/ZM adult fish. Each dot represents combined average of maximum ascent and descent angles observed for an individual fish. Horizontal lines show the overall average and vertical lines show the standard deviations. Red lines and data points are significantly different from black lines and data points (t-test, P=0.0055). (D) Reduced spontaneous scoot initiation by opa3ZM/ZM larvae. Circles show the average scoot frequency for four groups of 25 opa3+/+ larvae and triangles show the average scoot frequency for four groups of 25 opa3ZM/ZM larvae, each measured on three consecutive days. A significant reduction was observed in opa3ZM/ZM larvae (ANOVA test, F[1,9]=23.4, P=0.001).
|
