|
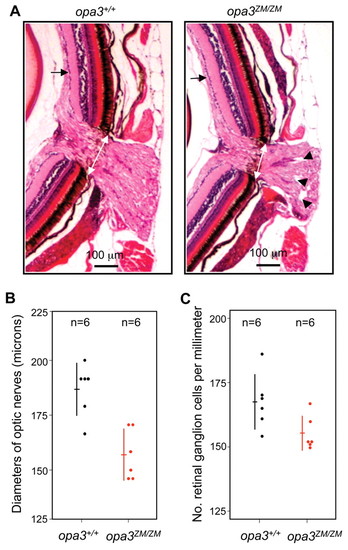
Optic nerve deficits in opa3ZM/ZM mutants. (A) Sections of opa3+/+ and opa3ZM/ZM adult retinas. Three 1-year-old adult fish for each genotype were coronally sectioned and Hematoxylin and Eosin stained. One representative section is shown for each genotype. White arrows indicate optic nerve diameters and measurement points. Arrowheads indicate optic nerve lesions. Black arrows indicate retinal ganglion cells. (B,C) Comparison of optic nerve diameters (B) and retinal ganglion cell numbers (C) in opa3+/+ and opa3ZM/ZM adult fish. Each dot represents a single measurement, horizontal lines show the average and vertical lines show the standard deviation. Red lines and data points are significantly different from black lines and data points (t-test, P<0.015).
|