|
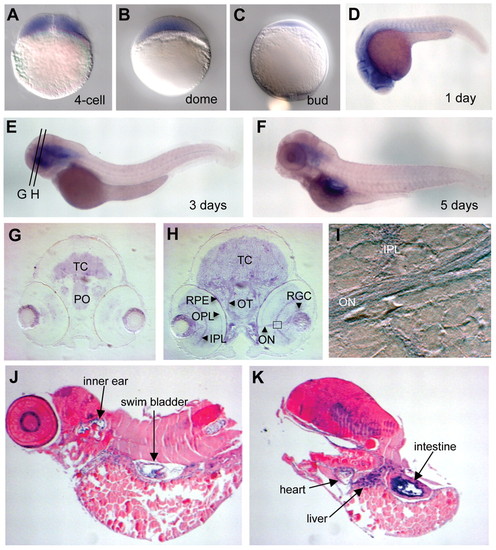
Zebrafish opa3 expression in the brain, eye and other organs during embryogenesis. (A-F) Whole-mount in situ stains of opa3 mRNA. Embryonic stages are as labeled. Orientations: A-F,J-K, lateral views; G-I, frontal views. (G-I) opa3 expression in brain and eyes. (G,H) Transverse sections (approximate positions shown in E) through a 3-day-old opa3-stained embryo. TC, tectum; PO, pre-optic region; RPE, retinal pigment epithelium; OPL, outer plexiform layer; IPL, inner plexiform layer; OT, optic tract; ON, optic nerve; RGC, retinal ganglion cells. I shows a higher magnification view of the boxed region in H. (J,K) opa3 mRNA expression in a 5-day-old embryo. Embryos were laterally sectioned and counterstained with nuclear Fast Red.
|