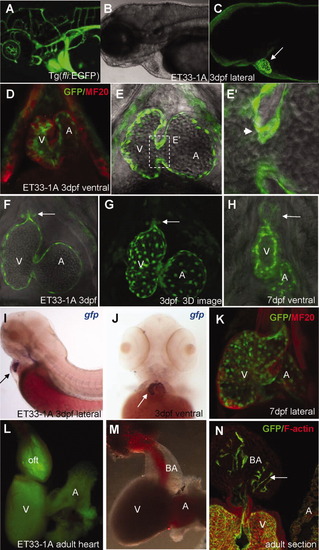
CETs that define development of the endocardium in vivo. A: Anterior vasculature in Tg(fli-GFP). B: Bright-field view of anterior body. C: Endocardium-specific EGFP expression in ET33-1A at low magnification. Arrow indicates fluorescence only in the heart. D, K: Confirmation of EGFP-positive cells in the endocardial layer as evidenced by double immunohistochemistry with MF20 (red), which marks the myocardium. EGFP-positive cells are in the inner layer: (D) 3 dpf, (K) 7 dpf. E-H: In vivo imaging of the endocardium at high magnification. G: High-resolution 3D reconstruction of the endocardium in vivo revealing the intricate network of endocardial cells. Arrowhead (E′) and arrows (F-H) point to endocardial leaflets at A-V junction and BA, which in the latter thickens from 3 dpf (F) to 7 dpf (H), respectively. I, J: Lateral (I) and ventral (J) views of the heart after WISH using anti-gfp probe. Arrows indicate the heart. L, M: Low-resolution fluorescent (L) and bright-field images (M) of adult heart. N: Adult heart sections immunostained with anti-EGFP and F-actin. All images (except A) are of ET33-1A. C, G: Fluorescent images. E, E′, F, H: Composite fluorescent/DIC images. A, atrium; BA, bulbus arteriosus; V, ventricle.
|
