
FIGURE
Fig. 2
- ID
- ZDB-FIG-091214-10
- Publication
- Bonkowsky et al., 2008 - Domain-specific regulation of foxP2 CNS expression by lef1
- Other Figures
- All Figure Page
- Back to All Figure Page
Fig. 2
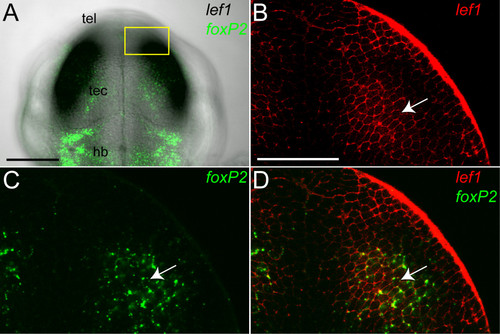
Co-expression of foxP2 and lef1 in the tectum. Whole-mount double in situ confocal imaging for foxP2 and lef1 at 36 hpf, dorsal views, anterior up. Abbreviations: hb, hindbrain; tec, tectum; tel, telencephalon. (A) Z-stack projection of foxP2 (green) overlaid on brightfield image of lef1 expression in the tectum. The region shown in higher magnification in (B-D) is boxed in yellow. Scale bar = 50 μm. (B-D) Single optical plane showing lef1 (red- BM Purple), foxP2 (green- Alexa 488), and co-expression in the tectum. Arrow points to a representative co-expressing cell. Scale bar = 25 μm. |
Expression Data
| Genes: | |
|---|---|
| Fish: | |
| Anatomical Term: | |
| Stage: | Prim-25 |
Expression Detail
Antibody Labeling
Phenotype Data
Phenotype Detail
Acknowledgments
This image is the copyrighted work of the attributed author or publisher, and
ZFIN has permission only to display this image to its users.
Additional permissions should be obtained from the applicable author or publisher of the image.
Full text @ BMC Dev. Biol.