
Fig. 2
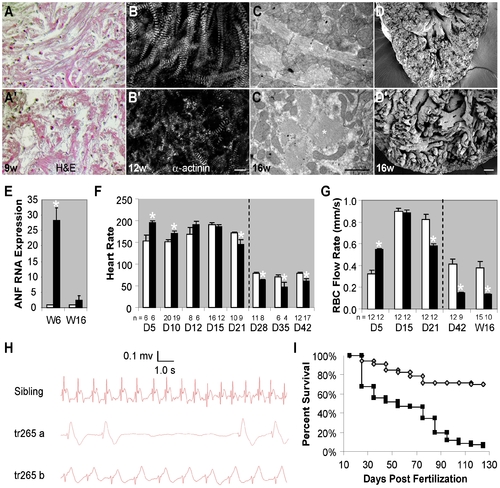
Progressive cardiomyopathy is associated with tr265/tr265. (A,A′) H&E-staining revealing muscular disarray in week-9 (A′) tr265/tr265 ventricles, compared to the control (A); bar = 50 μm. (B,B′) α-actinin antibody staining of week-12 ventricle sections (B, sibling, B′, tr265/tr265) (bar = 10 μm) and (C,C′) transmission electron microscopy of week-16 (C) sibling and (C′) tr265/tr265 ventricle sections (bar = 1 μm) showing abnormal sarcomeres; * = sarcomeres in C,C′. (D,D′) Disorganized papillary muscles in week-16 (D′) tr265/tr265 compared to (D) sibling viewed using scanning electron microscopy; bar = 400 μm. (E) Increased atrial natriuretic factor (ANF), a fetal gene and cardiac hypertrophy marker, in week-6 and not week-16 tr265/tr265 hearts, measured with real time PCR. (F) Changes in heart rate from day 5 to 42. (G) Red blood cell flow rate at day 4, week 6, and week 16, corresponding to the results in G. Anesthesia was used to keep the fish still for timepoints after the dashed line. (H) Electrocardiograms of a sibling and two tr265/tr265 fish at week 20. (I) Survival curves (Kaplan-Meier representation) of the sibling (◊) and tr265/tr265 (■). (F–H) mean±SEM; * = P<0.05. n = number of fish examined. |
| Fish: | |
|---|---|
| Observed In: | |
| Stage Range: | Day 5 to Adult |