
Fig. 3
- ID
- ZDB-FIG-090506-26
- Publication
- Laguerre et al., 2009 - Mitotic patterns in the migrating lateral line cells of zebrafish embryos
- Other Figures
- All Figure Page
- Back to All Figure Page
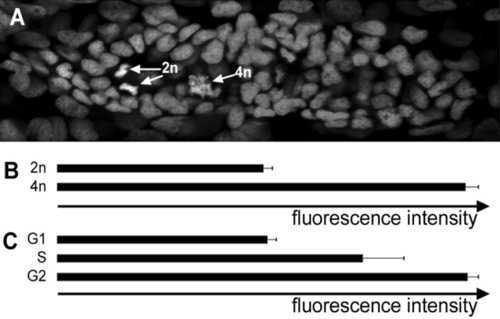
Patterning of the cell cycle. A: One focal plane of a primordium after Hoechst labeling. Each primordium was imaged as a Z-stack with 1 micron steps. The fluorescence of each nucleus was measured in each plane, and the ploidy was measured as the total intensity of fluorescence, as explained in the Experimental Procedures section. B: Total fluorescence of 20 nuclei that were in pro- or metaphase (2n), and of 12 nuclei in telophase (4n); fluorescence is expressed in arbitrary units. C: Total fluorescence in all the nuclei of the two primordia shown Figure 4. The nuclei were classified as G1, S, or G2 depending on the ratio of their total fluorescence relative to the 2n and 4n levels. |