
Fig. S2
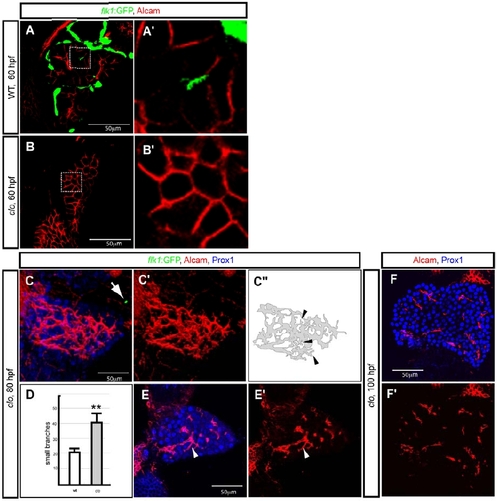
Defective hepatocyte polarization in cloche mutant larvae. (A, B) Wild-type (A) and clochela1164 (clo) mutant (B) larvae visualized for Tg(flk1:EGFP)s843 (green) and Alcam (red) expression at 60 hpf. The outlined areas are magnified and shown in A′ and B′. (C) Projected confocal image of a clochem378 (clo) mutant larva visualized for Tg(flk1:EGFP)s843 (green), Alcam (red) and Prox1 (blue) expression at 80 hpf. There are almost no endothelial cells in the trunk of clom378 mutant larvae, but occasionally a few Tg(flk1:EGFP)s843 positive cells are present (arrow). Alcam immunostaining is shown separately in C′ and is schematically presented in C″. It appears to exhibit extra small branches (arrowheads) compared to wild-type (Fig. 1B). (D) Number of small branches of the Alcam positive network in wild-type (average 22 branches per liver, n = 3, SD= 2.6) and cloche mutant (average 42 branches per liver, n= 4, SD = 5.7) livers at 80 hpf is shown in white and grey, respectively. (E) z-plane confocal images of the same clom378 mutant larva visualized for Prox1 (blue) and Alcam (red) expression. Alcam immunostaining is shown separately in E′. White arrowhead points to one of the small branches. (F) z-plane confocal images of a clom378 mutant larva visualized for Prox1 (blue) and Alcam (red) expression at 100 hpf. Alcam immunostaining is shown separately in F′. |