
Fig. S1
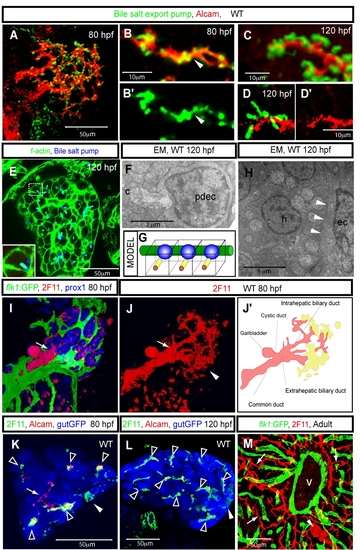
The biliary system in zebrafish. (A-G) The intrahepatic biliary network and bile canaliculi. Projected (A and C) and z-plane (B, D and E) confocal images of wild-type livers visualized for Alcam (red) and the canalicular marker Abcb11 (Bile salt export pump; green) at 80 (A and B) and 120 (C and E) hpf. Abcb11 immunostaining is shown separately in B′. Alcam immunostaining is shown separately in D′. (A) Alcam and Abcb11 co-staining reveals the intrahepatic biliary network and bile canaliculi at 80 hpf. (B) Alcam and Abcb11 immunostaining mostly overlap at 80 hpf (arrowhead). (C-D) The overlap between Alcam and Abcb11 immunostaining becomes restricted to the outer edge of the canaliculi by 120 hpf. (E) Z-plane confocal image of a 120 hpf liver visualized for F-actin (green) and Abcb11 (blue) expression. The outlined area is magnified and shown in bottom left corner. (F) Electron micrograph of a canaliculus (c) at 120 hpf, showing microvilli in the canaliculus. pdec, preductule biliary epithelial cell. (G) Schematic representation of the canaliculi in the zebrafish liver. Canaliculi (yellow rods) appear as tubular invaginations of the hepatocyte apical membranes. The vascular network (green) lines the basal side of the hepatocytes, nuclei are shown in blue. (H) Electron micrograph of the liver at 120 hpf. White arrowheads point to the border between a hepatocyte (h) and endothelial cell (ec). (I) Projected confocal images of Tg(flk1:EGFP)s843 larvae visualized for GFP (green), 2F11(red) and Prox1 (blue) expression at 80 hpf. The border between the intra and extra-hepatic biliary duct is indicated by an arrow. (J) Projected confocal image of the liver visualized by mAb 2F11 staining at 80 hpf. The common bile duct, gallbladder and extrahepatic and intrahepatic biliary ducts, which are visualized by mAb 2F11 staining, are schematically presented in J′. mAb 2F11 also stains cells in the periphery of the liver (arrowhead in J, yellow region in J′). Note that at this stage, 2F11 stains fewer branches of the intrahepatic biliary network than Alcam does. (K and L) Z-plane confocal image of a Tg(gutGFP)s854 liver visualized for GFP (pseudo-colored blue), Alcam (red) and 2F11 (pseudo-colored green) expression at 80 (K) and 120 (L) hpf. Alcam and 2F11 immunostainings mostly overlap in the liver (black arrowheads), however some intrahepatic ducts express Alcam but not the 2F11 antigen (white arrow) at 80 hpf. mAb 2F11 also stains cells in the periphery of the liver (white arrowheads). All confocal images of larval livers are ventral views, anterior to the top. (M) The biliary system in the adult zebrafish liver. The liver of a Tg(flk1:EGFP)s843 fish visualized for GFP (green) and 2F11 antigen (red) expression. The 2F11 antigen is expressed by all biliary epithelial cells, and it reveals the bile duct (arrowhead) and the preductule biliary epithelial cells (arrow). v, a major blood vessel in the liver. |