
Fig. 7
- ID
- ZDB-FIG-081013-33
- Publication
- Snow et al., 2008 - Time-lapse analysis and mathematical characterization elucidate novel mechanisms underlying muscle morphogenesis
- Other Figures
- All Figure Page
- Back to All Figure Page
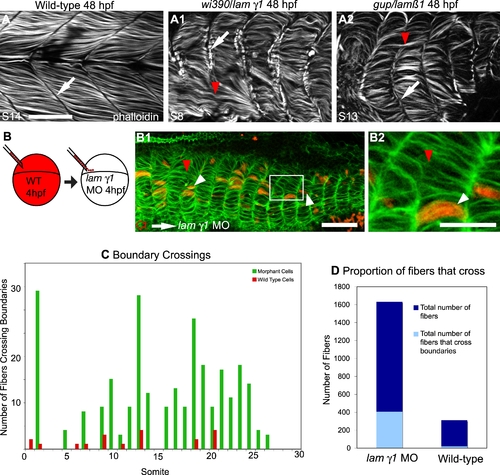
Laminin Plays a Role in Boundary Capture of Elongating Muscle Fibers. ApoTome micrographs, side views, anterior left, dorsal top of 48 hpf embryos. A–A2) MTJ boundaries are sometimes crossed in lamβ1 and lamγ1-deficient embryos. The MTJ in WT embryos is visible as the dark line of no phalloidin staining in between myotomes (A, white arrow). In both lamβ1 and γ1 mutants, MTJs are observed (A1–A2, white arrows), but sometimes a portion of an MTJ is crossed by a muscle fiber (red arrowheads, A1–A2). Scale bar: 50 μm. B–B2) Cell autonomous rescue of boundary crossing by control cells in lamγ1 morphant embryos. White box in B1 indicates the higher magnification view in B2. Transplanted control cells do not cross the MTJ boundary (white arrowheads, only 19/311 transplanted control cells crossed MTJ boundaries in lamγ1 morphant embryos compared to 402/1631 morphant cells). The red arrowhead indicates morphant cells that cross boundaries. Scale bars: 20 μm. C–D) Graphs showing boundary crossing by control cells and morphant cells. |
| Fish: | |
|---|---|
| Observed In: | |
| Stage: | Long-pec |