
- Title
-
Time-lapse analysis and mathematical characterization elucidate novel mechanisms underlying muscle morphogenesis
- Authors
- Snow, C.J., Goody, M., Kelly, M.W., Oster, E.C., Jones, R., Khalil, A., and Henry, C.A.
- Source
- Full text @ PLoS Genet.
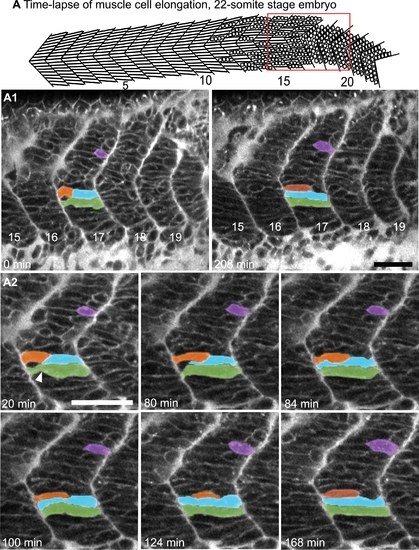
Myoblasts Intercalate between Each Other as They Elongate. (See also Movies S1 and S2.) A) Cartoon depicts the anterior to posterior progression of myofiber elongation in a 22 somite embryo. A1–A2) Confocal time-lapse sequence showing fast muscle cell elongation in a single focal plane of a zebrafish embryo vitally labeled with BODIPY-Ceramide. Anterior left, dorsal top, somite number denoted, time elapsed indicated on panels. The colored cells were pseudocolored to facilitate visualization. By 80 min, the blue cell is beginning to intercalate, intercalation is complete by 84 min. During this time, the orange and purple cells are elongating. The green cell transits from a long, but irregularly shaped cell (white arrowhead indicates a groove at 20 min) into a rod-shaped myotube by 124 min. Scale bars: 50 μm. |
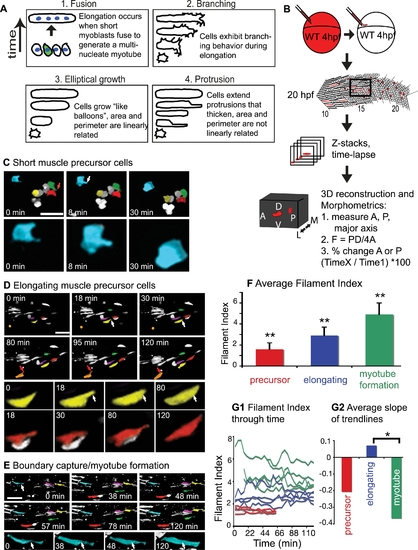
Three Phases of Muscle Morphogenesis: Short Muscle Precursor Cells, Intercalation/Elongation, and Boundary Capture/Myotube Formation. (See also Movie S3.) Projections of ApoTome micrographs are shown, side views, anterior left, dorsal top. Cells were pseudocolored to facilitate visualization. A) Cartoon depicting possible scenarios for elongation of myofibers. B) Cartoon depiction of the methods used. Dextran filled WT cells (red) were transplanted into an unlabeled embryo at the blastula stage, time-lapse data was collected at 20 hpf, then Z-stacks were three dimensionally projected for morphometric analysis. C) Short muscle precursor cells do not undergo large-scale shape changes. A 21 somite-stage embryo, approximate location of somite 15 at left. The blue cell extends a filopodia-like protrusion (8 min, white arrow) that is then retracted (30 min, the blue cell is enlarged in the bottom panels). The protrusion in the green cell (red arrow at 0 min) is also retracted by 30 min. D) Elongating muscle precursor cells extend protrusions along their major axis as they elongate. A 22 somite-stage embryo, somite 18 at left. The yellow cell extends a long, thin protrusion (white arrow) at 18 min that increases in thickness, resulting in a longer cell. The orange cell extends a protrusion (red arrow) at 80 min that becomes thicker by 120 min. E) Myotube formation involves the transition from an irregularly shaped cell to a more homogenously shaped tube. At 0 min, the blue cell with a white arrow is not yet tube-shaped, i.e. part of the cell is significantly narrower than the other parts (white arrow). Over time, the narrow portion thickens, eventually generating a long tube-shaped myotube (120 min, white arrows in bottom enlarged panels are in the same location in all panels). F) The filament index is significantly different between the three phases (**, p<0.01). G1) The filament index of the three phases through time. G2) Average slopes of linear trendlines from data in G1 (*, p<0.05). |
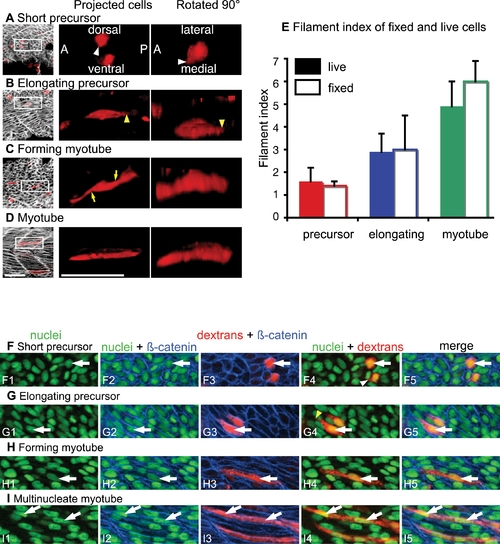
Mathematical Characterization of Fixed Cells Supports Time-Lapse Analysis of Live Cells. (See also Movie S4.) ApoTome images, side views, anterior left, dorsal top, 22 somite-stage fixed embryos. A–D) Dextran-labeled cells (red), β-catenin staining outlines cells (white). Rotated 90° projections were stretched≈3 fold in the Z dimension due to the relative thinness of the tissue. Scale bars: 50 μm. A) Short muscle precursor cells are short and extend small protrusions (white arrowheads). B) Long protrusions extended along the major axis of the cell are observed (yellow arrowheads). C) Irregularly shaped cells that span the entire width of the myotome are observed (yellow arrows). D) Long regularly shaped myotube. E) Graph showing that the filament indexes for live and fixed cells are similar. F–H) 22 somite-stage fixed embryo, nuclei are stained with Sytox green, dextran-labeled cells are red, β-catenin in blue outlines cells. Although the nuclear content of cells was analyzed in all focal planes, only one focal plane is shown for clarity. White arrows point to nuclei. F) Precursor cells are short and have one nucleus (white arrowhead in F4 shows short protrusion). G) Cells that were elongating when fixed were never observed to contain more than 1 nucleus (yellow arrowhead shows a long protrusion). H) An elongated cell with 1 nucleus. I) Multinucleate myotube. |
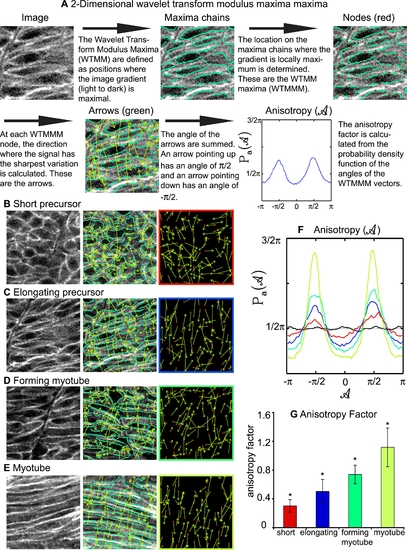
The 2D WTMM Method Is Used to Quantify Cellular Structure within a Lattice, and Indicates that Cellular Organization Increases during Muscle Morphogenesis. A) Description of how the 2D WTMM formalism quantifies structure. The starting image is of elongating muscle precursor cells stained for β-catenin to outline cells. B) Short muscle precursor cells have almost all WTMMM vector arrows pointing in random directions, indicating that there is only a small departure from isotropy (isotropy means randomly structured). C) Organization increases as muscle cells begin to elongate. Note more green arrows pointing either up or down in C than B. D) Organization continues to increase during the myotube formation phase. E) Organization is readily apparent when myotubes have formed. Note that most of the green arrows are pointing either up or down indicating high levels of organization. F) Averaged Pa(A) for one particular size scale (a∼7 μm) for the myotube stage (lime green curve), the forming myotube stage (dark green curve), elongating precursor stage (blue curve), short precursor (red curve) as well as for the isotropic fBm surfaces analyzed for calibration purposes (black curve fluctuating around π/2). Also shown is the flat 1/2π curve that would be obtained for a purely theoretical isotropic process (flat pointed line at 1/2π). G) The anisotropy factor Fa was averaged over all size scales analyzed. An indicator of organized structure, it shows significantly distinct values for all stages of developing muscle cells. |
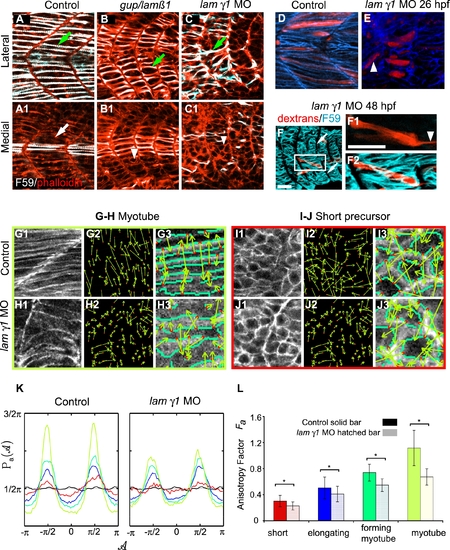
lamininβ1 and γ1 are Required for Normal Fast Muscle Cell Elongation. Panels A–C are confocal images and D–J are ApoTome micrographs. Panels A–C are side views, anterior left, dorsal top of 18 somite-stage embryos stained with F59 (white) to denote slow-twitch muscle and phalloidin (red) to outline fast muscle cells. Panels labeled 1 are lateral sections from a z-series and panels labeled 2 are medial sections from the same z-series. A) In WT embryos, fast-twitch muscle cells medial (A1, white arrow) to migrating slow-twitch fibers (A, green arrow) have elongated. B) Although some slow-twitch fibers do migrate in gup/lamβ1 mutant embryos, not all fast muscle precursor cells have elongated (B1 white arrowhead: short cell, B green arrow: slow-twitch muscle fiber that has migrated laterally). C) Not all fast muscle precursor cells medial to migrating slow fibers have elongated in lamγ1 morphant embryos (C1 white arrowhead: short cell, C green arrow: slow-twitch muscle fiber that has migrated laterally). Panels D–E are projected views of dextran filled cells (red) and β-catenin that outlines cells (blue). D) Elongated fibers in a WT embryo, note the organized, parallel array of fibers. E) Elongated fibers in a lamγ1-deficient embryo, white arrowhead denotes a fiber that is not parallel. F–F2) A dextran-filled cell in a lamγ1 morphant embryo extends a thin protrusion across the MTJ. White arrows denote the MTJ, white arrowhead denotes thin protrusion extending across the MTJ. F59 denotes slow muscle in blue and dextrans are red. Panel F1 is a single focal plane from a z-series, panels F and F2 are projections. Scale bars F: 50 μm, F1: 20 μm. G–H) Cells in the myotube phase are less organized in lamγ1 morphant embryos than in control embryos as shown by more randomly oriented WTMMM vector arrows. Panels numbered 3 are higher magnification views. I–J) Although differences in cellular structure are not obvious to the eye (compare I1 and J1), lamγ1 short precursor cells are less organized than control cells as shown by more randomly oriented WTMMM vector arrows. Panels numbered 3 are higher magnification views. K: The WTMMM vector angle pdfs are displayed for all stages (color coded per panel L), the isotropic fBm surfaces (black curve fluctuating around π/2), and the flat 1/2π curve that would be obtained for a purely theoretical isotropic process (flat pointed line at 1/2π). Note the stronger (higher) peaks in control embryos. L) The anisotropy factor of muscle cells in laminin-deficient embryos is significantly lower than in control embryos at all four stages of muscle morphogenesis (p<0.01). These results indicate that even though differences in organization as far back as the precursor stage are not obvious visually, they are unequivocally more disorganized than in controls when the anisotropic value is determined. EXPRESSION / LABELING:
PHENOTYPE:
|
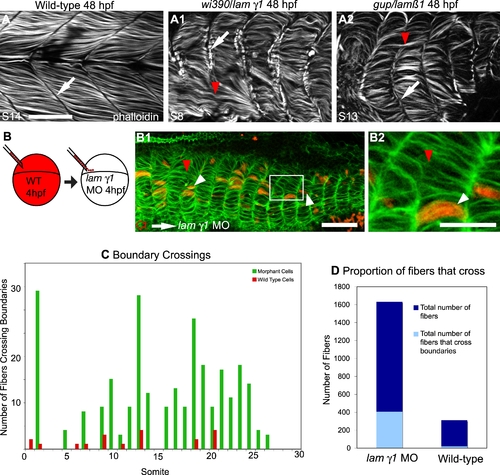
Laminin Plays a Role in Boundary Capture of Elongating Muscle Fibers. ApoTome micrographs, side views, anterior left, dorsal top of 48 hpf embryos. A–A2) MTJ boundaries are sometimes crossed in lamβ1 and lamγ1-deficient embryos. The MTJ in WT embryos is visible as the dark line of no phalloidin staining in between myotomes (A, white arrow). In both lamβ1 and γ1 mutants, MTJs are observed (A1–A2, white arrows), but sometimes a portion of an MTJ is crossed by a muscle fiber (red arrowheads, A1–A2). Scale bar: 50 μm. B–B2) Cell autonomous rescue of boundary crossing by control cells in lamγ1 morphant embryos. White box in B1 indicates the higher magnification view in B2. Transplanted control cells do not cross the MTJ boundary (white arrowheads, only 19/311 transplanted control cells crossed MTJ boundaries in lamγ1 morphant embryos compared to 402/1631 morphant cells). The red arrowhead indicates morphant cells that cross boundaries. Scale bars: 20 μm. C–D) Graphs showing boundary crossing by control cells and morphant cells. PHENOTYPE:
|
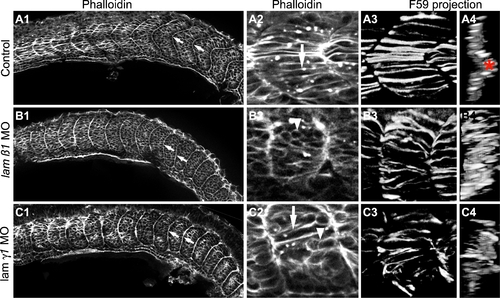
Somite Boundary Shape, Slow Muscle Migration and Fast Muscle Elongation are Disrupted in lamininβ1 and γ1-deficient Embryos. All panels are ApoTome images at the 18 somite stage. Side views, anterior left, dorsal top, except panels numbered 4 that are transverse views, lateral left, medial right. Panels 2–4 are higher magnification views of the embryos shown in panels numbered 1. Panels numbered 1 and 2 are single focal planes from a Z-series and show phalloidin staining that outlines all cells. Panels numbered 3 and 4 are projections of the entire Z-series of panels numbered 2. In these panels, F59 expression denotes slow-twitch muscle fibers. All panels (A1–C1, A2–C2) are from approximately the same anterior-posterior and medial-lateral position in control and morphant embryos. A1–C1) WT control embryos contain robust, chevron shaped boundaries. lamβ1 and lamγ1 morphants have rounder, flatter shaped boundaries. Note that intial somite boundaries, albeit less chevron-shaped, do form in lamβ1 and lamγ1 morphant embryos. A2–C2) Whereas fast muscle cells are elongating in control embryos (A2, white arrow), fast-twitch muscle cell elongation is disrupted in both lamβ1 (B2, white arrowhead) and lamγ1 (C2, white arrowhead) morphant embryos but some elongation does occur (white arrows). A3–C3/A4–C4) Myosin organization in slow-twitch muscle fibers is disrupted in lamβ1 and lamγ1 morphant embryos. In control embryos, the projected (panels numbered 3) and rotated transverse views (panels numbered 4) show organized slow-twitch fibers that have migrated laterally (muscle pioneers: red asterisk). Slow-twitch fiber organization, spacing, and migration, are disrupted in lamβ1 and lamγ1 morphant embryos. EXPRESSION / LABELING:
PHENOTYPE:
|