|
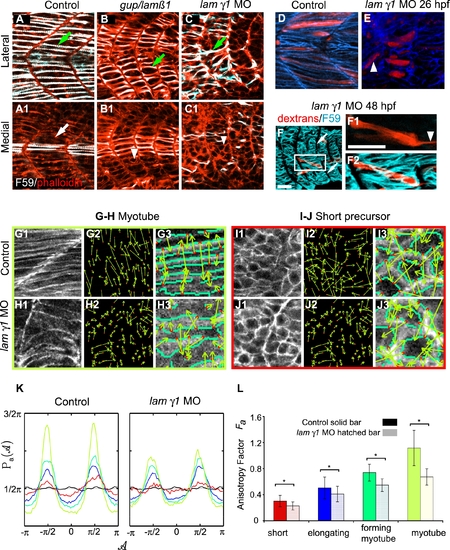
lamininβ1 and γ1 are Required for Normal Fast Muscle Cell Elongation. Panels A–C are confocal images and D–J are ApoTome micrographs. Panels A–C are side views, anterior left, dorsal top of 18 somite-stage embryos stained with F59 (white) to denote slow-twitch muscle and phalloidin (red) to outline fast muscle cells. Panels labeled 1 are lateral sections from a z-series and panels labeled 2 are medial sections from the same z-series. A) In WT embryos, fast-twitch muscle cells medial (A1, white arrow) to migrating slow-twitch fibers (A, green arrow) have elongated. B) Although some slow-twitch fibers do migrate in gup/lamβ1 mutant embryos, not all fast muscle precursor cells have elongated (B1 white arrowhead: short cell, B green arrow: slow-twitch muscle fiber that has migrated laterally). C) Not all fast muscle precursor cells medial to migrating slow fibers have elongated in lamγ1 morphant embryos (C1 white arrowhead: short cell, C green arrow: slow-twitch muscle fiber that has migrated laterally). Panels D–E are projected views of dextran filled cells (red) and β-catenin that outlines cells (blue). D) Elongated fibers in a WT embryo, note the organized, parallel array of fibers. E) Elongated fibers in a lamγ1-deficient embryo, white arrowhead denotes a fiber that is not parallel. F–F2) A dextran-filled cell in a lamγ1 morphant embryo extends a thin protrusion across the MTJ. White arrows denote the MTJ, white arrowhead denotes thin protrusion extending across the MTJ. F59 denotes slow muscle in blue and dextrans are red. Panel F1 is a single focal plane from a z-series, panels F and F2 are projections. Scale bars F: 50 μm, F1: 20 μm. G–H) Cells in the myotube phase are less organized in lamγ1 morphant embryos than in control embryos as shown by more randomly oriented WTMMM vector arrows. Panels numbered 3 are higher magnification views. I–J) Although differences in cellular structure are not obvious to the eye (compare I1 and J1), lamγ1 short precursor cells are less organized than control cells as shown by more randomly oriented WTMMM vector arrows. Panels numbered 3 are higher magnification views. K: The WTMMM vector angle pdfs are displayed for all stages (color coded per panel L), the isotropic fBm surfaces (black curve fluctuating around π/2), and the flat 1/2π curve that would be obtained for a purely theoretical isotropic process (flat pointed line at 1/2π). Note the stronger (higher) peaks in control embryos. L) The anisotropy factor of muscle cells in laminin-deficient embryos is significantly lower than in control embryos at all four stages of muscle morphogenesis (p<0.01). These results indicate that even though differences in organization as far back as the precursor stage are not obvious visually, they are unequivocally more disorganized than in controls when the anisotropic value is determined.
|