|
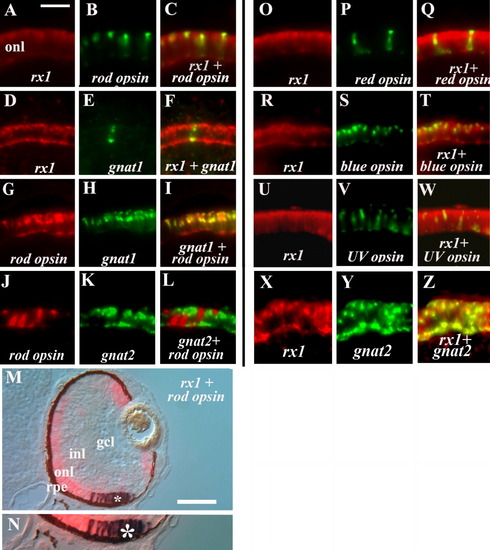
Rx1 expression in all photoreceptor subtypes. All panels show retinal cryosections of 72-hpf embryos. A-C: rx1 (A) and rod opsin (B) colabeling (C). D-F: rx1 (D) and gnat1 (E) colabeling (F). G-I: rod opsin (G) and gnat1 (H) colabeling (I; positive control). J-L: rod opsin (J) and gnat2 (K) show no colabeling (L; negative control). M,N: rx1 and rod opsin colabeling using an alternative set of reaction products; N is an enlargement of region in M indicated by *, showing colabeled cells. O-Q: rx1 (O) and red opsin (P) colabeling (Q). R-T: rx1 (R) and blue opsin (S) colabeling (T). U-W: rx1 (U) and uv opsin (V) colabeling (W). X-Z: rx1 (X) and gnat2 (Y) colabeling (Z). onl, outer nuclear layer; inl, inner nuclear layer; gcl, ganglion cell layer; rpe, retinal pigmented epithelium. Scale bar in A (applies to A-L, O-W) = 20 μm; in M = 50 μm.
|