
Fig. 2
- ID
- ZDB-FIG-080702-44
- Publication
- Hyatt et al., 1996 - Retinoic acid alters photoreceptor development in vivo
- Other Figures
- All Figure Page
- Back to All Figure Page
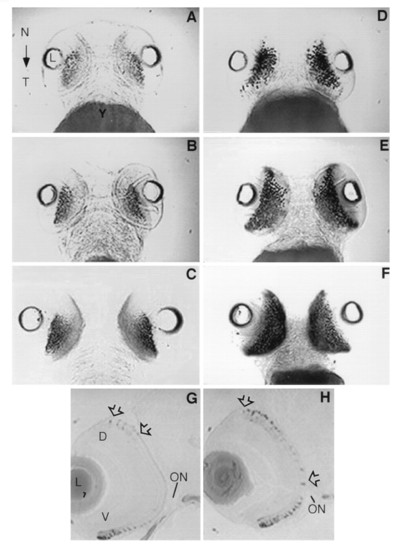
Control embryos (A–C) and RA-treated embryos (D–F) in ventral view showing the localization of rhodopsin mRNA expression by whole mount in situ hybridization. In controls, the level of rhodopsin mRNA expression increases modestly within the ventral retina during development through 3 (A), 4 (B), and 5 (C) days pf. After a 24-hr RA treatment beginning at day 2, staining within the ventral region is more robust indicating the level of rhodopsin expression has increased significantly (D). Not only is rhodopsin expression greater but it extends further into the nasal and temporal regions of the retina as compared with controls. After 2 and 3 days of RA treatment, the level of rhodopsin expression is further increased relative to the controls and extends throughout the ventral region as far as the nasal and temporal margins at days 4 (E) and 5 pf (F), respectively. The localization of rhodopsin transcripts by in situ hybridization at day 4 in transverse sections (5 μm) in control (G) and RA-treated (H) embryos. (G) On day 4, rhodopsin expression is evident within the periphery of the ventral retina (V). Weak expression is also observed near the dorsal (D) periphery (arrows). (H) After 2 days of RA treatment, rhodopsin expression extends throughout the ventral retina. Furthermore, expression is considerably more robust and extensive within the dorsal retina (arrows). ON, optic nerve; N, nasal region; T, temporal region; L, lens; Y, yolk. |