
Fig. 7
- ID
- ZDB-FIG-080604-85
- Publication
- Sidi et al., 2008 - Chk1 Suppresses a Caspase-2 Apoptotic Response to DNA Damage that Bypasses p53, Bcl-2, and Caspase-3
- Other Figures
- All Figure Page
- Back to All Figure Page
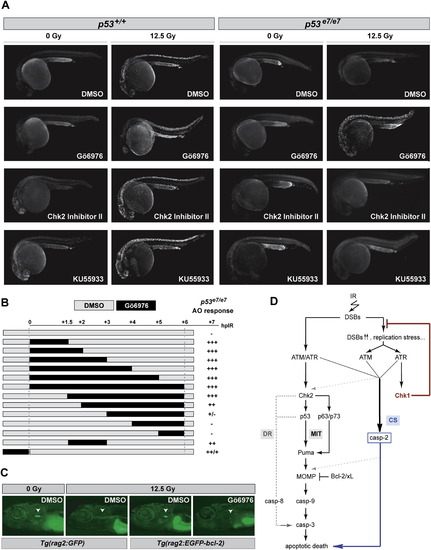
Effects of Gö6976 in Zebrafish In Vivo Models of p53 Loss and bcl-2 Gain (A) Fluorescent images of AO-labeled embryos of indicated genotypes photographed at 25.5 hpf. Embryos were exposed to 0 or 12.5 Gy IR and to the indicated drugs at 18 hpf. Gö6976, specific Chk1 inhibitor (1 μM). Chk2 Inhibitor II, specific Chk2 inhibitor (10 μM); KU55933, specific ATM inhibitor (10 μM). Note the range of toxicities in nonirradiated p53+/+ embryos treated with KU55933 or Chk2 Inhibitor II, with strong AO labeling preferentially localized in the brain and eyes (first column, third and fourth rows), as opposed to the Gö6976-treated embryo (first column, second row). Inversely, note the strong IR-induced AO labeling in the Gö6976-treated p53 mutant (last column, second row), but the lack of staining in the mutants treated with KU55933 or Chk2 Inhibitor II (last column, third and fourth rows). (B) Temporal requirement for Chk1 loss with respect to IR. p53 mutant embryos were exposed to Gö6976 for the indicated times. AO staining was quantified on a scale from “-” to “+++”with “-” representing the p53 mutant response and “+++” the response of sibling mutants treated with Gö6976 for 6 hr (∼500-fold greater response). (C) Fluorescent images of 9 dpf zebrafish larvae carrying the indicated transgene. Larvae were treated with 0 Gy or 15 Gy IR at 5 dpf and were exposed to Gö6976 (or DMSO as control) for a total of 5 days starting at 4 dpf. White arrowhead indicates the position of the thymus. Note the absence of detectable GFP in the Gö6976-treated Tg(rag2:EGFP-bcl-2) irradiated larva. (D) Simplified model for the vertebrate apoptotic response to DNA damage, highlighting the p53-independent pathway normally blocked by IR-activated Chk1 (CS, for Chk1-suppressed pathway), which is distinct from the classical intrinsic (mitochondrial, MIT) and extrinsic (death-receptor, DR) pathways. See text for details. |
Reprinted from Cell, 133(5), Sidi, S., Sanda, T., Kennedy, R.D., Hagen, A.T., Jette, C.A., Hoffmans, R., Pascual, J., Imamura, S., Kishi, S., Amatruda, J.F., Kanki, J.P., Green, D.R., D'Andrea, A.A., and Look, A.T., Chk1 Suppresses a Caspase-2 Apoptotic Response to DNA Damage that Bypasses p53, Bcl-2, and Caspase-3, 864-877, Copyright (2008) with permission from Elsevier. Full text @ Cell