
Fig. 6
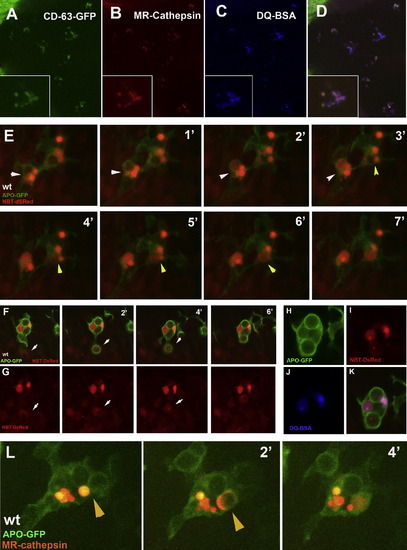
Time-Lapse Analysis of Vesicular Fusion Events (A–D) Colocalization of the genetically encoded lysosomal marker CD63/Lamp-GFP3 (I) with the lysosomal membrane permeable dyes MR-Cathepsin (J) and DQ-BSA (K). In the bottom left corner an enlargement is presented. (E) Confocal time-lapse of a single wild-type APO-GFP microglia and NBT DsRed neurons. Phagosomes of different intensity containing apoptotic neuronal material fuse (white arrowheads). Fusion is visible due to the spreading of dye from one vesicle into the other. Time is in minutes. (F and G) Confocal time-lapse of a single wild-type APO-GFP microglia and NBT DsRed neurons. The cell branches out to collect neuronal material and a new phagosome forms (white arrowhead). (H–K) The same cell as in (F). APO-GFP (H). NBT-DsRed (I). DQ-BSA (J). Merge (K). The newly formed vesicle is a phagosome and it is not yet labeled by the DQ-BSA dye. (L) Confocal time-lapse of a single wild-type APO-GFP microglia whose lysosomes are labeled in red by MR-chatepsin. The yellow arrowhead points at a fusion event between a lysososme (red) and a phagosome (green). Time is in minutes. |
Reprinted from Cell, 133(5), Peri, F., and Nüsslein-Volhard, C., Live Imaging of Neuronal Degradation by Microglia Reveals a Role for v0-ATPase a1 in Phagosomal Fusion In Vivo, 916-927, Copyright (2008) with permission from Elsevier. Full text @ Cell