
Fig. 5
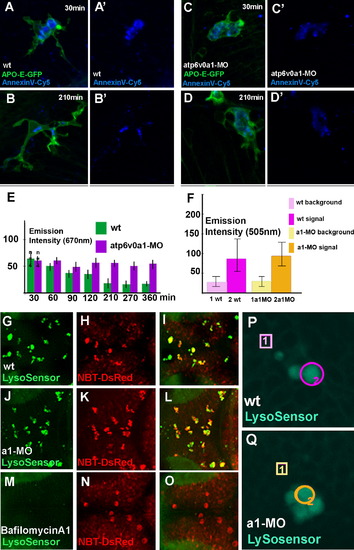
v0-ATPase a1 Knocked-Down Microglia Are Unable to Digest Apoptotic Neurons, However Vesicular Acidification Is Not Effected (A and B) Two time points (0 and 210 min) of confocal time-lapse of one APO-E-GFP wild-type microglial cell containing apoptotic material labeled by AnnexinV-Cy5 binding. Time is in minutes. (A′ and B′) AnnexinV-Cy5 labeling in the same microglial cell. (C and D) Two time points (0 and 210 min) of confocal time-lapse of one APO-E-GFP v0-ATPase a1 knocked-down microglial cell containing the apoptotic material labeled by AnnexinV-Cy5 binding. Time is in minutes. (C′ and D′) Confocal time-lapse of AnnexinV-Cy5 labeling in the same microglial cell. (E) Quantification of fluorescent intensity emission values at 670 nm (AnnexinV-Cy5) in wild-type microglia (green bars) and atp6v0a1 knocked-down microglia (purple bars). Error bars indicate standard deviation. Over time, AnnexinV-Cy5 staining disappears only from wild-type embryos. The data represent the average ± SD of four independent experiments. (F) We have measured fluorescent intensity values at 505nm (LysoSensor) in several wild-type vesicular clusters. (G–I) Dorsal views of a 3 dpf (days post fertilization) embryonic wild-type brain. (G) LysoSensor. (H) NBT-DsRed. (I) Merge. There is partial colocalization between acidic vesicles (green) and apoptotic cluster (red). (J–L) Dorsal views of a 3 dpf (days post fertilization) embryonic v0-ATPase-a1 knocked-down brain. (J) LysoSensor. (K) NBT-DsRed. (L) Merge. Acidic vesicles can be detected in v0-ATPase a1 knocked-down and they colocalize with the neuronal apoptotic clusters. (M–O) Dorsal views of a 3 dpf (days post fertilization) embryonic wild-type brain treated with Bafilomycin A1. (M) LysoSensor. (N) NBT-DsRed. (O) Merge. After Bafilomycin A1 treatment vesicles are no longer acidic and are not labeled by the LysoSensor. (P) and (Q) Examples of wild-type (P) and atpv0a1-MO (Q) acidic vesicular clusters, (purple circle [P]) and in atpv0a1-MO (yellow circle [Q]). We have also measured background fluorescent emission at 505nm in wild-type (purple square [P]) and in atpv0a1-MO (yellow square [Q]). Values from several different experiments have been plotted. Error bars indicate standard deviation. |
| Genes: | |
|---|---|
| Fish: | |
| Knockdown Reagent: | |
| Anatomical Terms: | |
| Stage: | Protruding-mouth |
| Fish: | |
|---|---|
| Knockdown Reagent: | |
| Observed In: | |
| Stage: | Protruding-mouth |
Reprinted from Cell, 133(5), Peri, F., and Nüsslein-Volhard, C., Live Imaging of Neuronal Degradation by Microglia Reveals a Role for v0-ATPase a1 in Phagosomal Fusion In Vivo, 916-927, Copyright (2008) with permission from Elsevier. Full text @ Cell