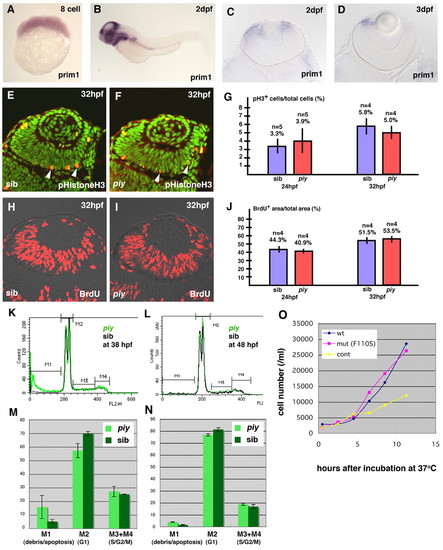
The missense mutation F110S does not affect cell proliferation. (A,B) Expression of prim1 mRNA in wild-type zebrafish embryos at the eight cell stage (A) and 2 dpf (B). The maternal expression of prim1 is observed (A). The prim1 gene is predominantly expressed in regions with high cell proliferation rate, such as the eyes and tectum at 2 dpf (B). (C,D) Plastic sections of wild-type retinas labeled with prim1 RNA probe at 2 dpf (C) and 3 dpf (D). The prim1 gene is expressed in the CMZ of the neural retina, suggesting that this gene is expressed in the proliferating cells of the retina. (E,F) Labeling of wild-type (E) and piy mutant (F) retinas with anti-phosphorylated histone H3 antibody (red, arrowheads). All nuclei are counterstained with Sytox Green (green). (G) Percentage of retinal cells that are dividing in wild-type (blue bar) and piy mutant (red bar) retinas at 24 hpf and 32 hpf. (H,I) BrdU labeling (red) of wild-type (H) and piy mutant (I) retinas. (J) Percentage of retinal area that is BrdU-positive in wild-type (blue bar) and piy mutant (red bar) retinas at 24 hpf and 32 hpf. (K,L) Representative traces from FACS analyses after propiduim isodide staining of dissociated cells from wild-type (black line) and piy mutant (green line) heads at 38 hpf (K) and 48 hpf (L). The traces are divided into four regions, M1, M2, M3 and M4, which represent cells with <2N, 2N, 2N-4N and 4N DNA, respectively. (M,N) Bar graph showing summary of FACS results from wild-type sibling and piy homozygous mutant dissociated cell pools at 38 hpf (M) and 48 hpf (N). The piy mutant embryos (light green) contain fewer G1/postmitotic cells and more apoptotic cells than wild type. However, there is no significant difference in the ratio of S/G2/M cells between wild-type and piy mutant embryos. (O) Proliferation rate of yeast pri1-1 mutant cells transformed with wild-type prim1, F110S mutated prim1 and control vector at 37°C. The proliferation rate of the yeast pri1-1 mutant cells transformed with the F110S mutant prim1 (pink) is not significantly different from that of the yeast pri1-1 mutant cells transformed with the wild-type prim1 (blue), whereas the proliferation rate of the yeast pri1-1 mutant cells transformed with the control vector (yellow) is low.
|
