Zebrafish mipt3 is required for morphogenetic development and acts synergistically with the gene encoding the basal body/ciliary protein, BBS4.
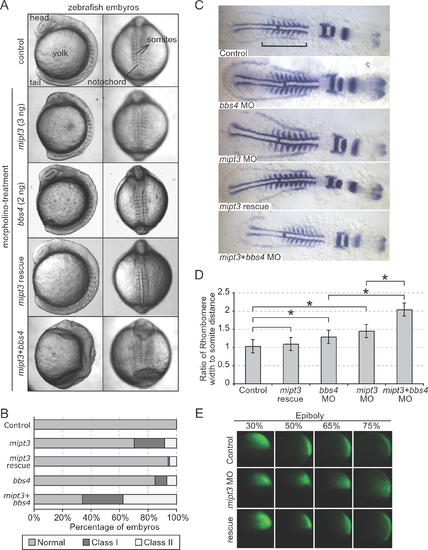
(A) Injection of a progressively increasing amount of a translation-blocking mipt3 morpholino (MO) gives rise to a spectrum of gastrulation phenotypes, including shortening of the embryonic axis, broadening and kinking of the notochord, lengthening of the somites and detachment of cells along the embryonic axis, all of which can be rescued with high specificity by the mipt3 mRNA. The presence of two of these phenotypes is scored as “Class I”, whereas three or more phenotypes are categorised as “Class II”. Representative images of control, mipt3, bbs4 and double morphants at the 8–10 somite stage, exhibiting a range of phenotypes. Note the profound lengthening of somites in the double morphant, as well as the loss of definition of head structures, and the complete failure of tail extension, phenotypes that are not seen in either single morphants. (B) Compared to a modest percentage of affected embryos in clutches injected with either 2 ng of a bbs4 MO or 3 ng of a mipt3 MO, co-injection of both bbs4 and mipt3 MOs leads to the widespread phenotypes mentioned in (A) that recapitulated and exacerbated the phenotypes of single morphants, with a particularly prominent expansion of Class II embryos to ~40%. (C) Somite-stage embryos were labeled with pax2, krox20 and myoD by in situ hybridization. As compared to both controls and embryos rescued by co-injecting MO with mipt3 mRNA, morphant embryos were shorter (see bar across the somitic trunk) and exhibited wider, thinner somites. Embryos injected with both mipt3 and bbs4 MO were significantly shorter and wider than embryos injected with either MO alone. The notochord, which is wider upon suppression of either mipt3 or bbs4, is also shown with an asterisk. (D) Quantitative assessment of morphant phenotypes. (A) The extent of gastrulation movement defects was quantified by calculating the ratio of the measurements of the width of the 5th rhombomere and the distance from the rhombomere to the first somite. Morpholino injection alone revealed an increase in the ratio as compared to controls. Bars above the graph indicate comparisons; asterisks annotate statistically significant differences (p<0.05). (E) At gastrulation stages, the movements of fluorescently-labeled cells descendent of a single labeled 16-cell blastomere were tracked. At 30% epiboly, no difference in the position of cells could be observed between control embryos and morphants. As embryos proceed through epiboly, cells in control embryos converge upon the dorsal midline and extend along the dorsal axis (top panels). Cells in morphant embryos do not converge and extend, which is indicative of defective gastrulation movements (middle panels). Cell movements are rescued with co-injection of WT zebrafish mipt3 mRNA (bottom panels). See Suppl. Fig. 4 for quantification.
|
