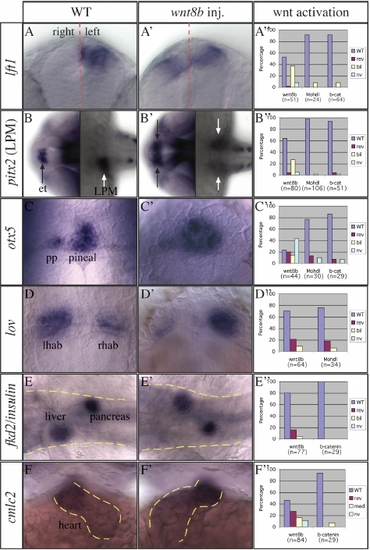
Manipulations that disrupt early Wnt pathway activity result in loss of asymmetry of Nodal pathway gene expression in the LPM and brain and heterotaxia phenotypes (A-F) The panels show wild-type expression of genes as indicated on the left. (A′-F′) To illustrate the effect of manipulation of Wnt signalling, the panels show the expression of the same genes in wnt8b injected embryos. (A,A′) Frontal views of the epithalamus and (B,B′) dorsal views of 24s stage embryos. Red dotted line indicates the midline, black arrows point at pitx2 expression in the epithalamus (et) and white arrows at pitx2 expression in the lateral plate mesoderm (LPM). (C,C′,D,D′) Dorsal views of the epithalamus at (C,C′) 2 days and (D,D′) 4 days of development. (E,E′) Dorsal and (F,F′) frontal views of 2 days old embryos. The yellow dotted line outlines (E,E′) the embryo and (F,F′) the heart. (A″-F″) The graphs illustrate the percentage of embryos with wild-type (WT) left, reversed (rev) right, bilateral (bil), medial (med) or not visible (nv) gene expression upon activation of the Wnt signalling pathway. lhab, left habenula; pp, parapineal; rhab, right habenula.
|
