
FIGURE
Fig. 6
Fig. 6
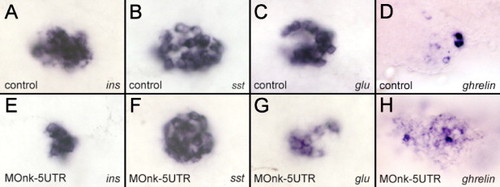
The endocrine pancreas in nkx2.2a-morphant embryos. Ventral views. (A–C, E–G) 32 hpf. (D, H) 48 hpf. Pancreatic hormone expression in control embryos (A–D) and representative MOnk-5UTR injected embryos (E–H). (A, E) Insulin, (B, F) somatostatin, (C, G) glucagon, (D, H) ghrelin. Using ImageJ software we could calculate that insulin expression in panel E is 52% less than control (A), while glucagon expression in panel G is 43% less than control (H). In panel H, ghrelin expression levels are 60% more than control (D). |
Expression Data
| Genes: | |
|---|---|
| Fish: | |
| Knockdown Reagent: | |
| Anatomical Terms: | |
| Stage Range: | Prim-15 to Long-pec |
Expression Detail
Antibody Labeling
Phenotype Data
| Fish: | |
|---|---|
| Knockdown Reagent: | |
| Observed In: | |
| Stage: | Prim-15 |
Phenotype Detail
Acknowledgments
This image is the copyrighted work of the attributed author or publisher, and
ZFIN has permission only to display this image to its users.
Additional permissions should be obtained from the applicable author or publisher of the image.
Reprinted from Developmental Biology, 304(2), Pauls, S., Zecchin, E., Tiso, N., Bortolussi, M., and Argenton, F., Function and regulation of zebrafish nkx2.2a during development of pancreatic islet and ducts, 875-890, Copyright (2007) with permission from Elsevier. Full text @ Dev. Biol.