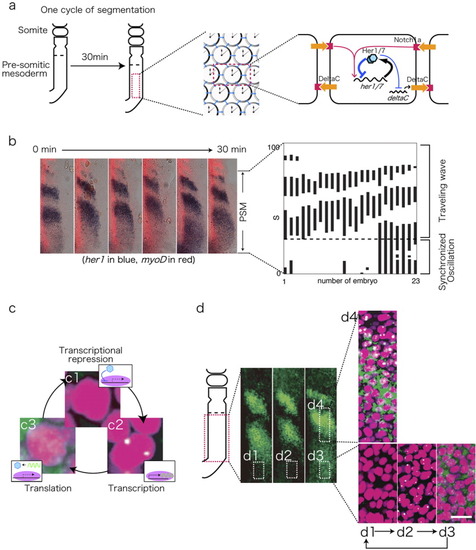
The segmentation clock in the zebrafish embryo. a: Schematic representation of the zebrafish presomitic mesoderm (PSM) and the PSM oscillators. Details are described in the text. b: Representative images and a graphic depiction of the her1 expression profile. The positions of the her1-positive cells in 23 embryos are indicated by a solid bar. The her1 expression domain appears every 30 min in the posterior PSM, and travels anteriorly. The mode of her1 expression changes from a synchronized to traveling mode in the intermediate zone (dotted line). c: High-resolution ISH detection of the subcellular localization of her1 mRNA. The PSM cells display a cycle of no signal (c1), nuclear dots (c2), and cytoplasmic signals (c3). d: Representative high-resolution ISH images of her1 expression (green). Numbered insets are enlarged in d1-d4. Nuclei are counter-stained with propidium iodide (magenta). d1-d3 indicate the posterior PSM, which exhibits synchronous oscillation, whereas d4 from the intermediate zone shows a gradual transition of transcription toward the anterior PSM. Scale bar = 20 μm.
|
