
- Title
-
Coupling cellular oscillators: A mechanism that maintains synchrony against developmental noise in the segmentation clock
- Authors
- Ishimatsu, K., Horikawa, K., and Takeda, H.
- Source
- Full text @ Dev. Dyn.
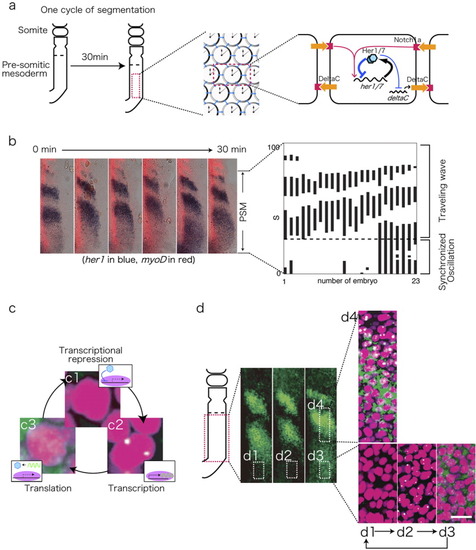
The segmentation clock in the zebrafish embryo. a: Schematic representation of the zebrafish presomitic mesoderm (PSM) and the PSM oscillators. Details are described in the text. b: Representative images and a graphic depiction of the her1 expression profile. The positions of the her1-positive cells in 23 embryos are indicated by a solid bar. The her1 expression domain appears every 30 min in the posterior PSM, and travels anteriorly. The mode of her1 expression changes from a synchronized to traveling mode in the intermediate zone (dotted line). c: High-resolution ISH detection of the subcellular localization of her1 mRNA. The PSM cells display a cycle of no signal (c1), nuclear dots (c2), and cytoplasmic signals (c3). d: Representative high-resolution ISH images of her1 expression (green). Numbered insets are enlarged in d1-d4. Nuclei are counter-stained with propidium iodide (magenta). d1-d3 indicate the posterior PSM, which exhibits synchronous oscillation, whereas d4 from the intermediate zone shows a gradual transition of transcription toward the anterior PSM. Scale bar = 20 μm. EXPRESSION / LABELING:
|

Notch-dependent intercellular communication in the segmentation clock. a: Cell-transplantation assay at the blastula stage. b: Donor cells that constitutively expresses DeltaC due to a morpholino-knockdown of Her. c: Effects of her-MO cells on the transcription of her1 (left) and on the segmentation points (right). The timing of her1 transcription is locally advanced in the area near to the explants in the posterior PSM. The nuclei, her1 mRNA, and explants are stained in red, green, and blue, respectively. Arrowheads indicate nuclear her1 cells, the phase of which is advanced by transplantation. This effect results in a segment-shift phenotype. The segment positions are anteriorly shifted on the transplanted side (arrows). Donor cells are in red and the dashed line indicates the last normally formed segment border. Scale bar = 20 μm. d: 1-D simulation of oscillating PSM cells (dots). Snapshots of the calculated results in the 1st (up) and 10th-round of oscillation (down) are shown. An actively signaling cell is represented by a red arrow. The active signal from the transplanted cell influences the adjacent cell to accelerate the oscillating. After 10 rounds of oscillation, the oscillation phase of the red PSM cell advances by 13.2%, as compared with the green PSM cell that is located far from the signaling cell. This effect is transmitted in succession, and results in the phase-shift of relatively distant cells, although the effect is still locally limited. e: The smaller somite (red solid box) is formed by the accelerated oscillation (red line). The spatial pattern of clock oscillation (lines at the bottom) is translated according to the clock-and-wavefront mechanism. |
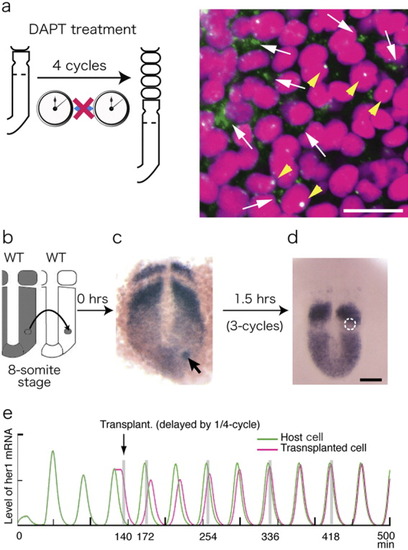
Notch-dependent phase synchronization. a: Disrupted synchrony in 10-somite-stage embryos transiently treated with DAPT for 2 hr. A large number of cells go out of phase, showing both delayed (arrows) and advanced (arrowheads) phases, in the synchronized zone of the posterior PSM (compare with 1d1-3 in the normal PSM). Scale bar = 20 μm. b-d: Wild-type cells of the posterior PSM were directly transplanted into normal embryos at the same axial level. her1 expression is shown (purple) in these embryos just after transplantation (arrow in c) and at 1.5 hr later (d). Donor cells in d are encircled with white dots. Scale bar = 50 μm. e: Interaction between two oscillating groups calculated by 1-D simulation. A cell with a delayed phase (1/4-cycle) is transplanted at t = 140 min (arrow). The phase of the explants is gradually synchronized to that of the host over several rounds of oscillation. The levels of her1 mRNA in the host (green) and explant cells (magenta) are traced as a function of time. For details, see Horikawa et al. ([2006]). |