
Fig. 1
- ID
- ZDB-FIG-070416-1
- Publication
- Krock et al., 2007 - Noncell-autonomous photoreceptor degeneration in a zebrafish model of choroideremia
- Other Figures
- All Figure Page
- Back to All Figure Page
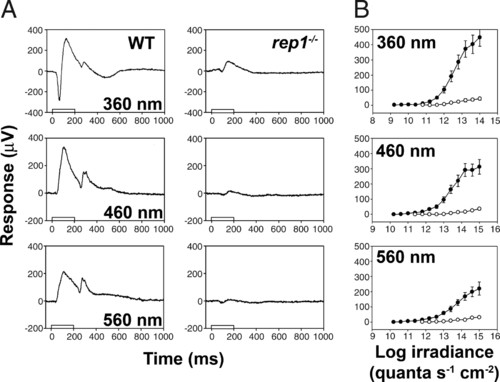
ERG analysis of rep1 mutant larvae. (A) ERG responses from 5 dpf wild-type (Left) and mutant (Right) to 200-msec flashes of light at the designated wavelengths. Each waveform was based on the average response from 10 stimulus presentations. Stimulus irradiance (15 log quanta s-1·cm-2) was the same across all panels. Bars represent the light stimulus. (B) Graph of the average irradiance-response functions from wild-type (filled circles; n = 11) and mutant (open circles; n = 14) subjects based on the b-wave amplitude at three different wavelengths. Error bars represent ±1 SEM. A mixed-design ANOVA found a significant difference (P d 0.05) between the wild-type and mutant responses at the last five irradiances tested. |
| Fish: | |
|---|---|
| Observed In: | |
| Stage: | Day 5 |