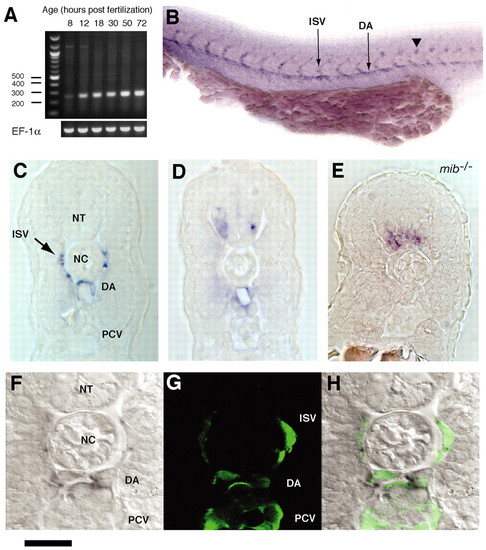
Expression of dll4 in wild-type and mutant zebrafish embryos. (A) RT-PCR analysis of whole homogenized embryos, showing weak dll4 expression as early as 8 hpf, becoming steadily stronger thereafter; EF-1α is a control. (B) Side view of a wild-type 25-hour-old embryo stained by in situ hybridization. dll4 is expressed in the dorsal aorta (DA) and intersegmental vessels (ISV), and in a subset of neurons in the neural tube (arrowhead). (C) Cross section through the trunk of a similar specimen showing dll4 expression in endothelial cells of the DA and ISVs but not in those of the posterior cardinal vein (PCV). (D) Similar section at a slightly different level relative to somite boundaries does not pass through any ISVs but reveals cells expressing dll4 in the ventrolateral neural tube (NT), as well as in the DA. (E) Cross section through the trunk of a 25-hour-old mib-mutant embryo. dll4 expression is increased and extended in the neural tube, but is undetectable in the endothelial cells. The expanded expression in the neural tube (and ear, for which data not shown) indicates that, in these tissues, dll4, like other delta genes, is regulated by lateral inhibition, so that its expression increases when Notch signalling fails. The loss of expression in the endothelial cells probably reflects their partial conversion to a venous character as a result of the failure of Notch signalling at an early stage (Lawson et al., 2001). The gross anatomy is also somewhat disturbed. (F-H) The neighbourhood of the notochord (NC) in a fli1:EGFP transgenic embryo, comparing dll4 expression (visible in the DA and ISVs by in situ hybridization; F,H) with the endothelium-specific expression of EGFP (green, visible by immunofluorescence in the DA, ISVs and PCV; G,H). Scale bar: 100 μm in B; 70 μm in C-E; 35 μm in F-H.
|
