
Fig. 6
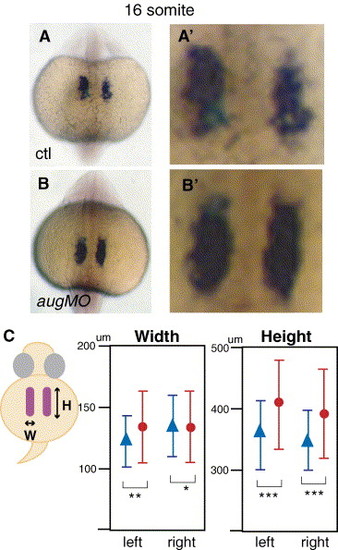
sema3D morphants have normal precardiomyocytes in LPM before neural crest arrival and diminished number of cardiomyocytes later. Dorsal views cmlc2 expression in control (A, A′) and sema3D-aug morphants (B, B′) at the 16 SS. Panels A′ and B′ are magnified cmlc2 expression pattern. (C) Schematic diagram of width (W) along the proximal–distal axis and height (H) along the anterior–posterior axis of cmlc2 expression (purple). Graphs indicate mean ± one standard deviation of width and height measured (μm) in sema3D morphants (red circles, n = 32) and controls (blue triangles, n = 37). Before the arrival of neural crest cells, the size of the primary heart field in sema3D morphants is similar to or slightly larger than the heart field in controls. *P = 0.624, **P = 0.09, ***P = 0.005. |
| Gene: | |
|---|---|
| Fish: | |
| Knockdown Reagent: | |
| Anatomical Term: | |
| Stage: | 14-19 somites |
Reprinted from Developmental Biology, 298(1), Sato, M., Tsai, H.J., and Yost, H.J., Semaphorin3D regulates invasion of cardiac neural crest cells into the primary heart field, 12-21, Copyright (2006) with permission from Elsevier. Full text @ Dev. Biol.