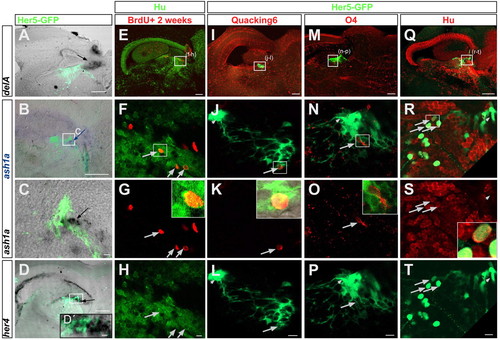
Her5-positive cells differentiate into neurons and oligodendroglia in vivo. (A-D) Expression of proneural genes within or near the IPZ, indicating an ongoing neurogenesis in that area. deltaA (A), ash1a (B,C) and her4 (D,D') are detected by in situ hybridization on sagittal sections of her5:gfp brains (anterior left) and visible as a black or blue (in B) signal (indicated by the arrows). All panels are an overlay of brightfield and fluorescence exposures, also revealing Her5-GFP protein in green. Note some overlap between Her5-GFP and ash1a (C) or her4 (D'). (E-H) Generation of neurons (Hu-positive cells in green) 2 weeks after BrdU injection (red) next to the IPZ, in a 6-month-old non-transgenic brain. Confocal planes of a sagittal section (anterior left) seen as an overview in E, and magnified in F-H. The arrows point to BrdU/Hu double-positive cells. The inset in G depicts an enlarged double-labelled cell boxed in F. (I-P) Differentiation of Her5-GFP-positive cells (green) into oligodendrocytes. Confocal planes of a sagittal section (anterior left) as an overview in I and M, and magnified in the panels below. Some Her5-GFP-positive cells pointed to by the long arrows co-express QKI-6 (J-L, enlarged in the inset in K) or O4 (N-P, inset in O). Small arrows in J,L,N,P point to the ventricular Her5-GFP-positive cells, which are negative for QKI-6 or O4. (Q-T) Differentiation of Her5-GFP-positive cells into neurons. Confocal planes of a sagittal section (anterior left) seen as an overview in Q, and magnified in R-T. All Her5-GFP-positive cells located away from the ventricular surface express the neuronal marker Hu (long arrows in R-T to some of them, enlargement of one double-labelled cell in the inset in S). The small arrows in R-T point to the ventricular Her5-GFP-positive population, which is Hu-negative. Scale bars: 100 μm in A,B,D and in the upper row; 10 μm in C,F-H,J-L,N-P,R-T.
|
