
Fig. 3
- ID
- ZDB-FIG-061121-44
- Publication
- Chapouton et al., 2006 - her5 expression reveals a pool of neural stem cells in the adult zebrafish midbrain
- Other Figures
- All Figure Page
- Back to All Figure Page
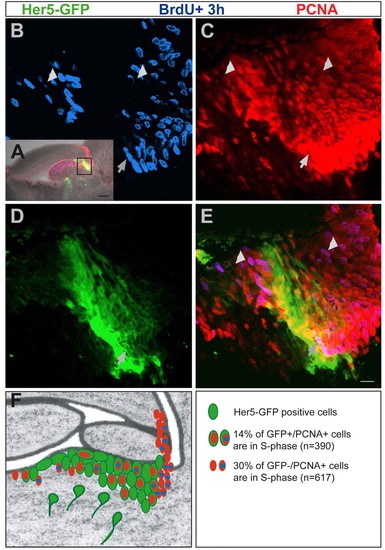
Her5-GFP-positive cells are slow proliferating. Sagittal section (anterior left) through a 3-month-old her5pac:egfp transgenic brain 4 hours after BrdU incorporation. BrdU, PCNA and Her5-GFP are co-detected by immunocytochemistry (BrdU, blue; PCNA, red; Her5-GFP, green). (A) Overview of the midbrain-hindbrain area (anterior left), showing the area analysed in B-E (boxed). (B-E) Close up on the IPZ, single confocal plane. Her5-GFP-positive cells express PCNA (compare C with D) but few are BrdU-positive. One of these triple-labelled cells is shown by the arrow. This indicates the long cell cycle of Her5-GFP-positive cells. By contrast, a high proportion of the neighbouring Her5-GFP-negative, PCNA-positive population incorporated BrdU (short arrows point to such cells), indicating their short cell cycle. (F) Summary drawing of the IPZ area (as in Fig. 1J, Fig. 2H), depicting BrdU labelling (blue) within the Her5-GFP ventricular population and within the neighbouring PCNA-positive, Her5-GFP-negative population. The slow-proliferating Her5-GFP-positive population is juxtaposed along the AP to fast-proliferating domains, which are Her5-GFP-negative. The labelling indexes of her5-positive versus her5-negative domains are indicated on the bottom right. Scale bars: 100 μm in A; 10 μm in B-E. |