
Fig. 3
- ID
- ZDB-FIG-061102-3
- Publication
- Gavaia et al., 2006 - Osteocalcin and matrix Gla protein in zebrafish (Danio rerio) and Senegal sole (Solea senegalensis): Comparative gene and protein expression during larval development through adulthood
- Other Figures
- All Figure Page
- Back to All Figure Page
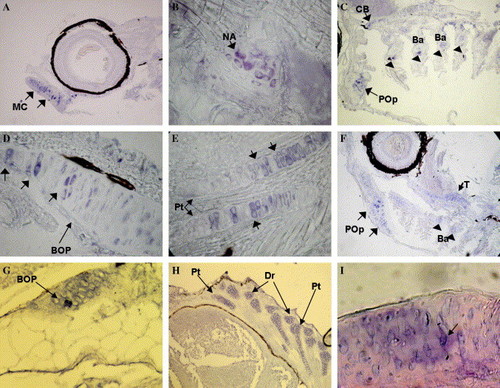
In situ localization of zebrafish and sole bgp mRNA. bgp gene expression was detected by in situ hybridization in sections of zebrafish (A–G) and sole (G–I) larvae collected at different ages and developmental stages. (A) bgp expression in the calcifying Meckel’s cartilage (arrows) of an 11 dpf larva (200×). (B) Detection of bgp expression in a neural arch (arrowhead) at the beginning of formation at 11 dpf (1000×). (C) At 13 dpf, bgp expression is detected in the branchial arches (BA) (arrowheads), ceratobranchial (CB), and calcifying preopercular bones (Pop) (arrow) (100×). (D) At 20 dpf, bgp expression is detected in chondrocytes of the BOP (arrows) (1000×). (E) Expression is visible in the mineralizing internal fin support skeleton, in this case the pterigophores (Pt) of the dorsal fin of a 24 dpf zebrafish (1000×). (F) At 24 dpf, bgp expression is strongly detected in the calcifying preopercular bones (arrows), branchial arches (arrowheads), and trabeculae (small arrow) (100×). (G) bgp expression in the first vertebra forming over the notochord (arrow), just posterior to the BOP at 15 dpf (400×). (H) Expression in the dorsal pterigophores (Pt) and distal radials (Dr) of a 20 dpf larvae (200×). (I) Expression in the dorsal pterigophores (Pt) and distal radials (Dr) of a 20 dpf larva (200×). (I) Osteoblasts (arrow) expressing bgp in the mandibula of a 56 DAH juvenile sole (1000×). For other abbreviations, see Fig. 1. |
| Gene: | |
|---|---|
| Fish: | |
| Anatomical Terms: | |
| Stage Range: | Days 7-13 to Days 21-29 |
Reprinted from Gene expression patterns : GEP, 6(6), Gavaia, P.J., Simes, D.C., Ortiz-Delgado, J.B., Viegas, C.S., Pinto, J.P., Kelsh, R.N., Sarasquete, M.C., and Cancela, M.L., Osteocalcin and matrix Gla protein in zebrafish (Danio rerio) and Senegal sole (Solea senegalensis): Comparative gene and protein expression during larval development through adulthood, 637-652, Copyright (2006) with permission from Elsevier. Full text @ Gene Expr. Patterns