
Fig. 5
- ID
- ZDB-FIG-061102-5
- Publication
- Gavaia et al., 2006 - Osteocalcin and matrix Gla protein in zebrafish (Danio rerio) and Senegal sole (Solea senegalensis): Comparative gene and protein expression during larval development through adulthood
- Other Figures
- All Figure Page
- Back to All Figure Page
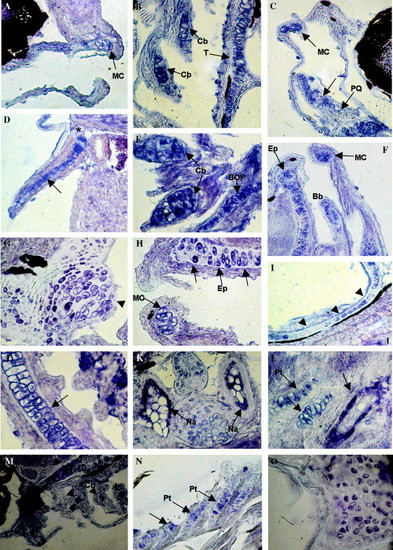
In situ localization of zebrafish and sole mgp mRNA. Sites of mgp gene expression were detected by in situ hybridization in sections of zebrafish (A–L) and sole larvae (M–O). (A) mgp expression in the ethmoid plate of a 96 hpf larva (200×). (B) Detection of mgp expression in chondrocytes from the trabecular cartilage (T) and ceratobranchial arches from a 9 dpf larva (Cb) (1000×). (C) mgp expression in Meckel’s cartilage (Mc) and palato quadrate (PQ) in a 9 dpf larva (100×). (D) Cartilage from the pectoral fin of a 10 dpf larva showing mgp expression located within the chondrocytes (arrow). Note the absence of signal in the cleithrum (asterisk) (1000×). (E) In 13 dpf larvae, mgp expression in the ceratobranchials (Cb) and in the BOP (1000×). (F) At 13 dpf, mgp expression was also evident in the hypertrophic chondrocytes from Meckel’s cartilage (Mc), ethmoid plate (Ep), and in chondrocytes from the basibranchial cartilage (Bb) (200×). (G) mgp expression in a 16 dpf larva, showing expression in chondrocytes from the BOP (arrowhead) (1000×). (H) At 16 dpf, mgp expression is also detected in hypertrophic chondrocytes of Meckel’s cartilage (Mc) and in chondrocytes from the ethmoid plate (Ep) (1000×). (I) 17 dpf larva showing mgp expression in chondrocytes from the optic capsules (arrowheads) (1000×). (J) Gill filaments showing mgp expression close to the plasma membrane in chondrocytes from the Zellknorpel (arrow) (1000×). (K) mgp expression in endosteal cells surrounding the vertebral centra from the neural arch (Na) in a 25 dpf larva (1000×). (L) mgp expression in chondrocytes from the pterigophores in a 25 dpf larva (Pt). Note also the presence of fusiform cells surrounding the central core of a vertebra (arrow) (1000×). (M) mgp expression at the ceratobranchials (Cb), trabecula (T), and hyosymplectic (asterisk) at 11 dpf (200×). (N) mgp expression in the chondrocytes of the dorsal pterigophores (Pt) at 17 dpf (500×). (O) mgp gene expression in the vertebral cartilage at 47 dpf (1000×). |
| Gene: | |
|---|---|
| Fish: | |
| Anatomical Terms: | |
| Stage Range: | Day 4 to Days 21-29 |
Reprinted from Gene expression patterns : GEP, 6(6), Gavaia, P.J., Simes, D.C., Ortiz-Delgado, J.B., Viegas, C.S., Pinto, J.P., Kelsh, R.N., Sarasquete, M.C., and Cancela, M.L., Osteocalcin and matrix Gla protein in zebrafish (Danio rerio) and Senegal sole (Solea senegalensis): Comparative gene and protein expression during larval development through adulthood, 637-652, Copyright (2006) with permission from Elsevier. Full text @ Gene Expr. Patterns