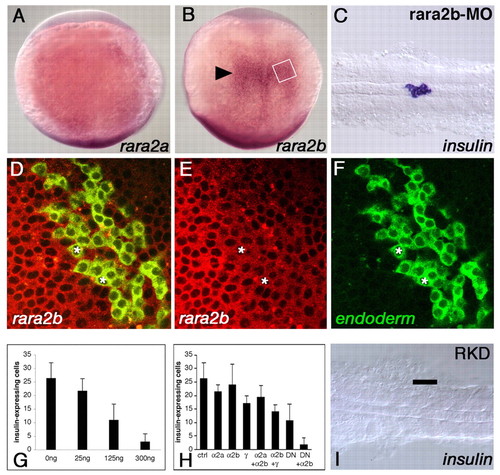
Pancreas development is dependent on RAR function. (A) rara2a expression in dorsal view at 10 hpf. (B) rara2b expression in dorsal view at 10 hpf; arrowhead indicates the approximate AP position where the pancreas will develop. (C) insulin is expressed at 24 hpf following morpholino knock-down of RARα2b (indistinguishable from controls; data not shown). (D-F) rara2b expression in endoderm cells; examples are indicated by asterisks. Confocal images of rara2b expression (red) at 10 hpf, SOX32-positive donor-derived endoderm is labeled with fluorescein (green). Approximate area of image is boxed in B. (G) DN-RARα2a mRNA blocks insulin expression in a dose-dependent fashion (concentrations injected in ng/µl). (H) Histogram showing number of insulin-expressing cells in uninjected control embryos (n=44) compared with embryos injected with RARα2a-MO (n=11), RARα2b-MO (n=12), RARα-MO (n=12), RARα2a-MO plus RARα2b-MO (n=10), RARα2b-MO plus RARα-MO (n=7), DN-RARα2a mRNA (125 ng/ml; n=11) and DN-RARα2a mRNA (125 ng/ml) plus RARα2b-MO (RAR knock-down, RKD; n=85). Error bars indicate standard deviation. (I) Co-injection of DN-RARα2a mRNA and RARα2b-MO blocks insulin expression.
|
