
Fig. 7
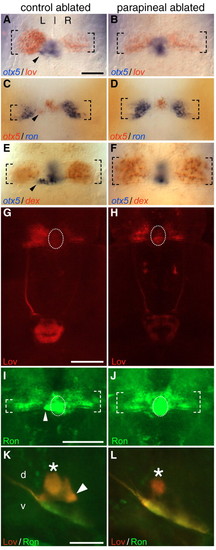
The parapineal mediates asymmetry of the habenulointerpeduncular system. (A,C,E) Control-ablated larvae (dashed brackets indicate anteroposterior extent of gene expression). otx5 expression confirmed parapineal position (arrowhead in A,C,E) and extent of ablation. (B,D,F) Parapineal ablation results in reduced lov (B; n=24), and expanded ron (D; n=58) and dex (F; n=16) expression in left habenula (4 days). A-F are dorsal views, anterior to top; scale bar: 50 µm. (G-J) Control-ablated Tg(foxd3:GFP) larvae (n=27) show WT pattern of Lov (G) and Ron (I) immunofluorescence. GFP is detected in the pineal (dotted oval) and parapineal (arrowhead) of transgenic larvae even after fixation and antibody labeling. Following parapineal ablation (n=42), Lov labeling (H) was reduced in the left habenula and axons in the left FR, while Ron immunofluorescence (J) expanded in the left habenula. G-J are confocal Z-stacks from the dorsal aspect, anterior to top; scale bars: 40 µm for G,H and I,J. (K) Control ablated larvae show the same IPN projection pattern as WT (see Fig. 2). (L) In parapineal ablated larvae, Lov+ projections to dorsal IPN are reduced and Ron+ axons increased ventrally. Asterisk and arrowhead in K indicate anterior and posterior domains of dorsal IPN. K,L are confocal Z-stacks from the lateral aspect anterior to the left; scale bar: 30 µm. |