|
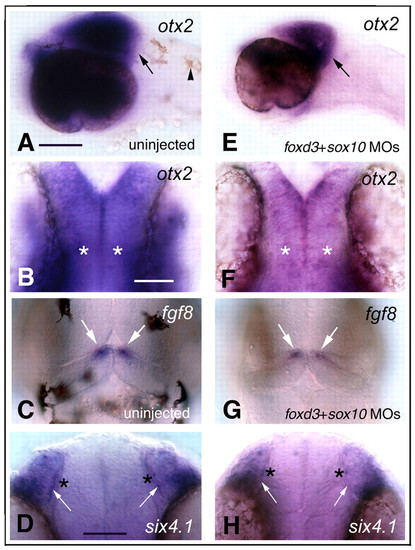
otx2, fgf8 and six4.1 genes are expressed in a normal spatio-temporal pattern in the foxd3+sox10 morphant embryos. (A-D) Uninjected embryos showing the pattern of otx2 (A,B), fgf8 (C) and six 4.1 (D) gene expression at 35±1 hpf. (E-H) Corresponding pattern of gene expression of otx2 (E,F), fgf8 (G) and six 4.1 (H) in foxd3+sox10 morphant embryos at 35±1 hpf. (A,E) Lateral views with MHB gene expression (arrow), and pigment cells in the uninjected animals (A, arrowhead). (B,F) Dorsal view showing otx2 expression in the midbrain; asterisks indicate the approximate location of the gnrh2 cells at this stage of development. (C,G) Dorsal views showing that fgf8 expression (arrows) is maintained at the MHB. (D,H) Ventral view of olfactory organs (arrows) expressing six4.1; asterisks indicate where the gnrh3 cells would be found at this stage of development. Scale bars: 100 µm in A,E; 50 µm in B,C,F,G; 100 µm in D,H.
|