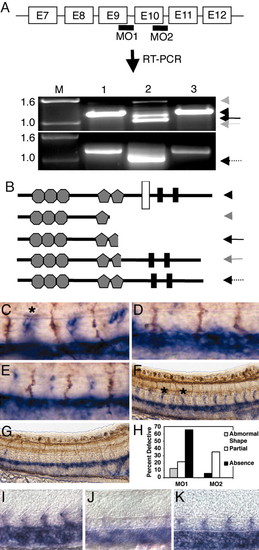
Splice MO targeting and endothelial marker analysis of MO-injected embryos. (A) The exon-intron genomic structure from exon 7-12 is shown. Splice MO1 and MO2 target the predicted TM domains. Total RNA was extracted from uninjected (lane 1), MO (lane 2; MO1, upper gel; MO2, lower gel), and msMO (lane 3; msMO1, upper gel; msMO2, lower gel) embryos at 24 hpf, and RT-PCR was performed. Black, gray, and dotted arrows indicate the alternative transcripts that were generated in MO-targeted embryos (lane 2), the black arrowhead indicates a common untargeted bands in lanes 1 and 3, and the gray arrowhead points to 1.5-kb band in lane 2. E, exon. (B) Structural details of predicted protein products generated from aberrant splicing are shown. Hexagons, pentagons, white bar, and black bars represent IgG, FN, TM, and CC domains, respectively. Double staining with flk digoxigenin RNA (blue) and Ab to znp-1 (C-E) (brown) or acetylated tubulin (F and G) in the trunk region of 22-24 som is shown. (C-G) Magnified images of the trunk region, showing WT (C and F), MO1-injected (8 ng) (D and G), and MO2-injected (8 ng) (E) embryos. Asterisk indicates location of ISV. (H) Quantification of embryos with ISV defects. WT (I), MO1 (J), and msMO1 (K) show in situ staining for cdh5 marker at 24 hpf. Anterior is to the left.
|
