
- Title
-
Behavioral and molecular insights into anxiety in ube3a and fmr1 zebrafish models of autism spectrum disorders
- Authors
- Dougnon, G., Matsui, H.
- Source
- Full text @ Transl Psychiatry
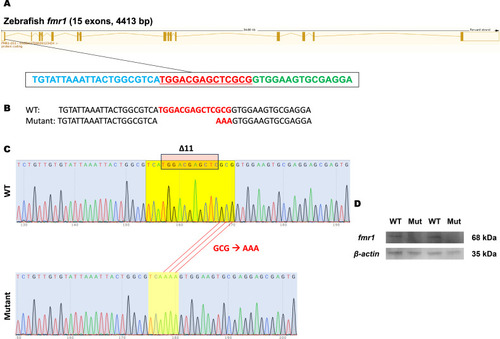
Creation and validation of the ( |
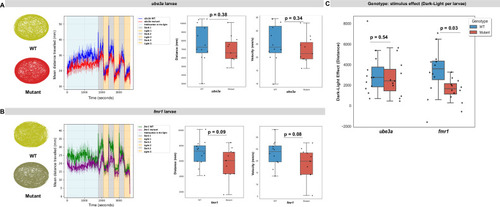
Locomotor activity during the light-dark test (LDT) in larval ( PHENOTYPE:
|
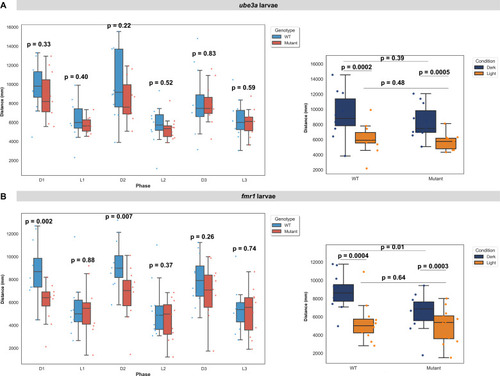
Distances travelled during the light-dark test (LDT) in larval ( PHENOTYPE:
|
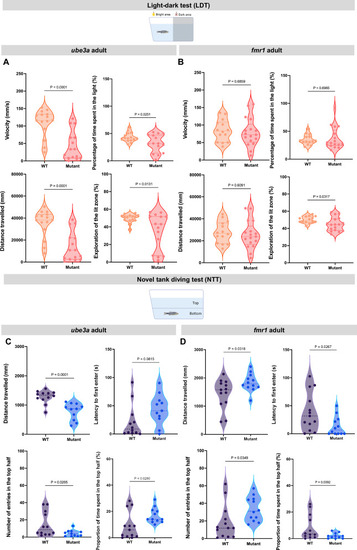
Locomotor and anxiety-related behavior during the LDT and novel tank test (NTT) in adult ( PHENOTYPE:
|
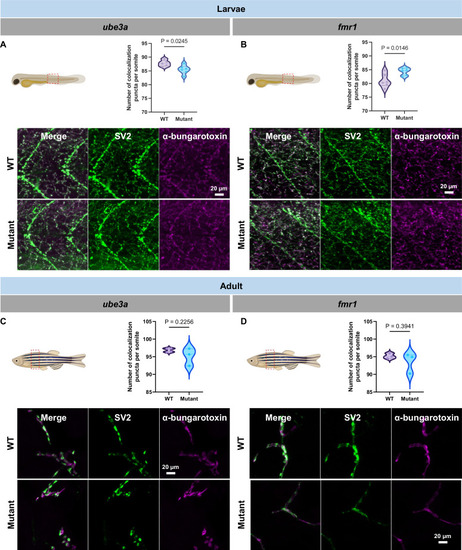
Neuromuscular junction integrity in larvae and adult ( |
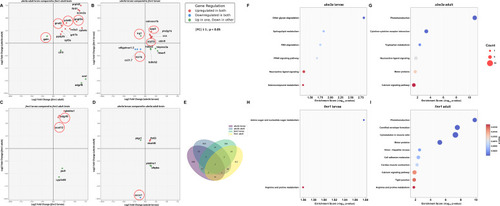
Comparative expression of potential anxiety and stress-related genes dysregulated in ( |