|
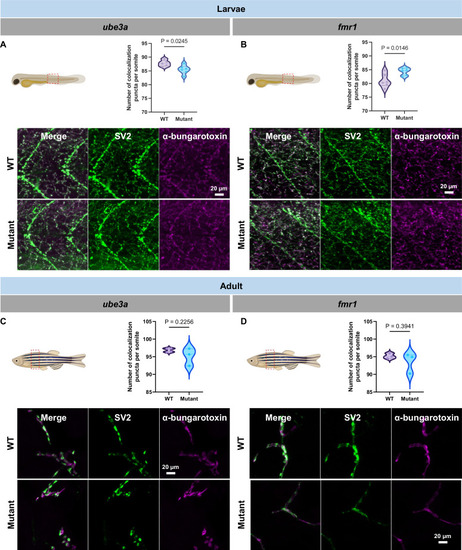
Neuromuscular junction integrity in larvae and adult ube3a and fmr1 zebrafish. (A) Representative image of a larvae with dashed lines indicating the analyzed region (Top left panel); Graph representing the number of colocalization puncta per somite between ube3a WT (N = 5) and mutants (N = 6); unpaired t test (Top right panel); Representative confocal pictures of ube3a WT and mutant larvae stained with SV2 antibody (green) and α-bungarotoxin (magenta) (Bottom panel). (B) Representative image of a larvae with dashed lines indicating the analyzed region (Top right panel); Graph representing the number of colocalization puncta per somite between fmr1 WT (N = 6) and mutants (N = 6); unpaired t test (Top right panel); Representative confocal pictures of ffmr1 WT and mutant larvae stained with SV2 antibody (green) and α-bungarotoxin (magenta) (Bottom panel). (C) Representative image of an adult zebrafish with dashed lines indicating the region sectioned for transverse section (Top left panel); Graph representing the number of colocalization puncta per somite between ube3a WT (N = 3) and mutants (N = 3); unpaired t test (Top right panel). Each dot represents an average of 3 different sections; Representative confocal pictures of ube3a WT and mutant adult trunk stained with SV2 antibody (green) and α-bungarotoxin (magenta) (Bottom panel). (D) Representative image of an adult zebrafish with dashed lines indicating the region sectioned for transverse section (Top left panel); Graph representing the number of colocalization puncta per somite between fmr1 WT (N = 3) and mutants (N = 3); unpaired t test (Top right panel). Each dot represents an average of 3 different sections; Representative confocal pictures of fmr1 WT and mutant adult trunk stained with SV2 antibody (green) and α-bungarotoxin (magenta) (Bottom panel). The data are presented as the mean ± SEM. Exact P values are presented in the Figures. Zebrafish drawings were created using BioRender.com.
|