FIGURE SUMMARY
Title

Telomerase Depletion Accelerates Ageing of the Zebrafish Brain

Authors
Martins, R.R., Besse, S., Ellis, P.S., Sevil, R., Hartopp, N., Purse, C., Everett-Brown, G., Evans, O., Mughal, N., Wahib, M.H.F., Yazigan, Z., Morsli, S., Jimenez-Gonzalez, A., Grierson, A., Mortiboys, H., Hammond, C., Rera, M., Henriques, C.M.
Source
Full text @ Aging Cell

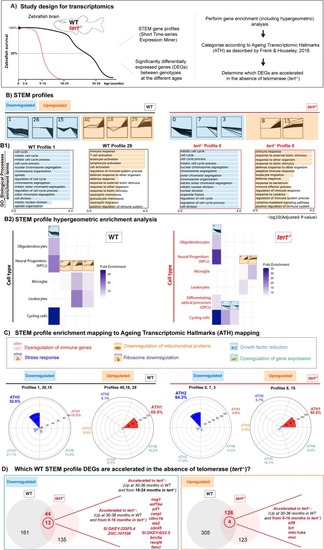
Transcriptomic signatures of ageing in the presence and absence of telomerase in the zebrafish brain. (A) Schematic figure of the study design for transcriptomics: RNA from whole brain tissue from young (2–6 months), young adult (9–16 months), middle aged (18–24 months) and old, (30–36 months) WT fish, and young (2–6 months), middle aged (9–16 months) and old (18–24 months) tert−/− fish was used for RNA sequencing. N = 3 per group. Transcriptomic alterations of ageing were analysed using two complementary approaches: STEM profiles and traditional DEG analysis between genotypes at different ages. Enrichment analysis and hypergeometric analysis were performed to identify the predominant pathways altered with ageing in the presence and absence of telomerase, and the DEGs were mapped to the ageing transcriptomic hallmarks (ATH). (B) Plots of the profiles identified by the STEM analysis (profiles containing down‐regulated genes in blue and profiles containing up‐regulated genes in orange) in both WT and tert−/− zebrafish brains, and (B1) top enrichment pathways (GOBP) identified in representative profiles. (B2) STEM profile hypergeometric enrichment analysis in WT and tert−/− brains identified which cell populations are mainly affected with ageing in the presence and absence of telomerase. (C) The genes identified by STEM analysis were then mapped to ATH. Plots show the proportion of genes mapped to each ATH, in both WT and tert−/− fish. (D) Venn diagrams highlight the genes identified in the STEM profiles of WT fish that are accelerated in the absence of telomerase (i.e., in tert−/− fish).

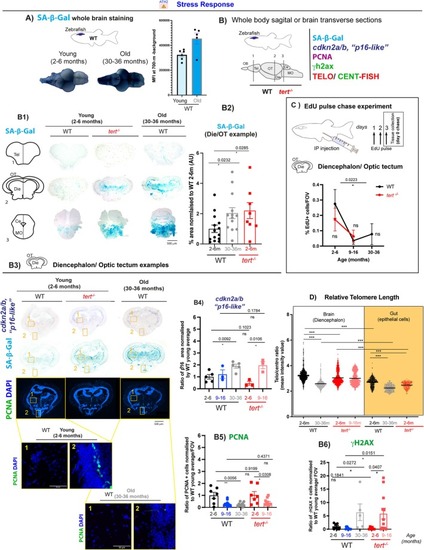
Telomerase (tert) depletion accelerates ageing‐associated stress response in the zebrafish brain. Brain tissue collected from 2–6 months, 9–16 months and 30–36 months WT fish, and 2–6 months and 9–16 months tert−/− fish were used to assess stress response by SA‐β‐Gal staining, cdkn2a/b (‘p16‐like’) RNA expression, proliferation (PCNA and EDU staining), telomere length and DNA damage. (A) Whole brain SA‐β‐Gal staining in young and old WT fish and respective quantification show an increased expression of SA‐β‐Gal in old WT brains compared to young ones. N = 5–6 per group. (B) Schematic figure showing the regions of the brain assessed for senescence‐associated markers. (B1) Representative images of SA‐β‐Gal staining in coronal cryosections of WT and tert−/− zebrafish show that there is an increased expression of SA‐β‐Gal in old WT zebrafish (30–36 months) and that a similar pattern is observed in tert−/− at the young age of 2–6 months, particularly in the diencephalon and optic tectum for which (B2) quantifications are shown. N = 8–14 per group. (B3) Representative images from in situ hybridisation in coronal cryosections, show an increased expression of cdkn2a/b (‘p16‐like’) in WT zebrafish > 30 months optic tectum and diencephalon, in areas where SA‐β‐Gal expression is observed. This increase in p16 expression is already significant at 9–16 months of age in tert−/−. Quantifications shown in B4. N = 3–5 per group. (B3) Representative images of PCNA and γH2AX staining in adjacent sections from zebrafish brain, in coronal cryosections. (B5) Proliferation assessed by PCNA staining show a decrease in proliferation with ageing in both WT and tert−/− fish but this is not accelerated in the absence of telomerase. N = 3–7 per group. (B6) DNA damage response assessed by γH2AX staining show increased DNA damage in WT fish 30–36 months, this increase is accelerated in the tert−/− fish from 9–16 months age. N = 3–7 per group. (C) Similar to what was observed by PCNA staining, proliferation assessment by EdU staining after a 3‐day pulse experiment show a decrease in proliferation with ageing in both WT and tert−/− brains, but this is not accelerated in the absence of telomerase. N = 3–7 per group. (D) Relative telomere length, assessed by telo/cent‐FISH, in longitudinal paraffin sections of zebrafish brain (white) and gut (yellow), show that telomere length decreases with ageing in WT fish (30–36 months) and that this is accelerated in young tert−/− fish (2–6 months). N = 4–5 per group. (A, B2, B4, B5, B6) Each dot represents one animal. (D) Each dot represents one cell. Error bars: SEM. *p < 0.05; **p < 0.01; ***p < 0.001. Abbreviations: OB, olfactive bulb; Tel, telencephalon; Die, diencephalon; OT, optic tectum; Ce, cerebellum; MO, medulla oblongata.

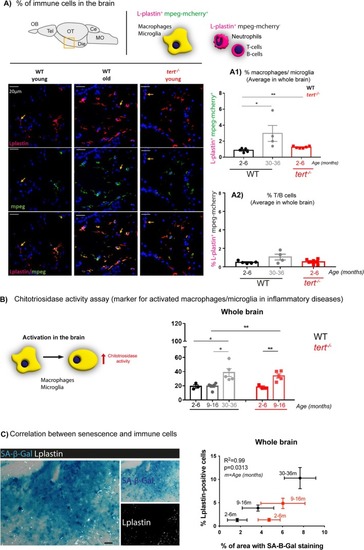
Telomerase depletion is associated with increased inflammation in the aged zebrafish brain. (A) Representative images of mpeg‐mcherry and L‐plastin staining in the diencephalon of adult zebrafish (schematic figure highlights the region imaged as diencephalon). The yellow arrows highlight Lplastin+; mpeg cells. (A1) Quantifications of L‐plastin‐positive; mpeg‐positive cells (orange; from red and green co‐localisation) and (A2) L‐plastin‐positive; mpeg‐negative cells (red) in the whole zebrafish brain show an increased number of macrophages/microglia (L‐plastin‐positive; mpeg‐positive cells) with natural ageing, and this is accelerated in the absence of telomerase (in tert−/− at 2–6 months of age). However, we observed no differences in the number of T/B cells and neutrophils (L‐plastin‐positive; mpeg‐negative cells) with ageing, in the WT or tert−/− fish. N = −6 per group. (B) Schematic figure of the chitotriosidase assay (left). Quantifications (right) show that chitotriosidase activity increases with natural ageing at > 30 months of age, and that this is accelerated in the tert−/− at the age of 9–16 months. (C) Representative images of co‐staining with SA‐β‐Gal (blue) and L‐plastin (white) in brain sections show that most of the L‐plastin‐positive cells do not co‐localise with the SA‐β‐Gal staining (left). Staining quantification shows a significant correlation between increased number of immune cells and increased expression of SA‐β‐Gal with ageing in both WT and tert−/− (right). (A1, A2, B) Each dot represents one animal. (A1, A2, B, C) Bar errors represent the SEM. * < 0.05; ** < 0.01.

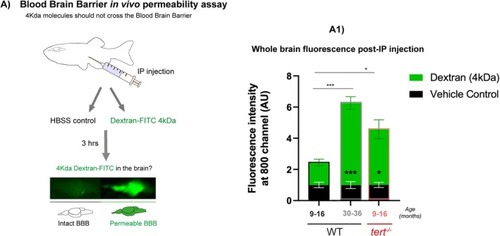
Telomerase depletion is associated with increased BBB permeability with ageing in the zebrafish brain. (A) Schematic figure of the BBB permeability assay. Dextran‐FITC 4 kDa or vehicle control (HBSS) were injected by intraperitoneal injection. 3 h later the brains were dissected and imaged in the Odyssey CLx (Li‐cor) to confirm the presence of Dextran‐FITC. Quantification of the green fluorescence in the fish brains shows higher FITC expression in old WT (> 30 months) compared to middle aged ones (9–16 months). This increased presence of dextran‐FITC in tert−/− is already observed at 9–16 months, overall suggesting that there is increased brain permeability with natural ageing and that this is anticipated in the absence of telomerase. N = 9–20 per group in the tested animals; N = 3–6 per group in the vehicle control animals. Bar errors represent the SEM. Statistics: Unpaired t‐tests. *p < 0.05; ***p < 0.001.

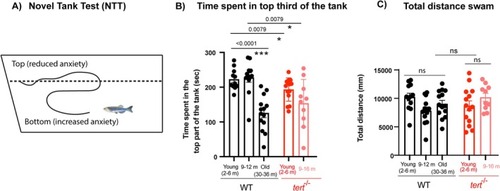
Telomerase depletion accelerates ageing‐assoicated increase in anxiety‐like behaviour. (A) Schematic figure of the setup and behaviour assessment during the novel tank test (NTT). (B) Quantifications show that old WT (30–36 months) spend less periods of time in the top part of the tank compared to younger siblings, and that this behaviour is accelerated in tert−/− from the age of 2–6 months. (C) Quantifications of the total distance swam during the entirety of the test show no differences between groups, suggesting that the differences observed in the time spent in the top area of the tank are not explained by locomotive defects. N = 10–14. Each dot represents a fish. Bar errors represent the SEM. *p < 0.05; ***p < 0.001.

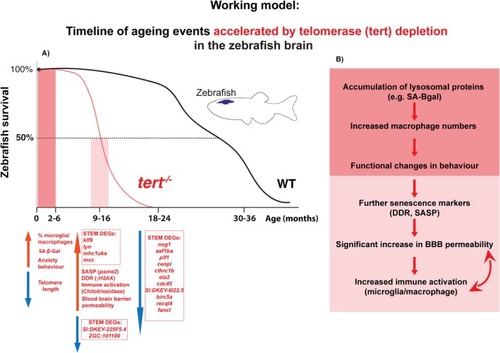
Working model: Timeline of ageing events accelerated by telomerase depletion in the zebrafish brain. (A) Survival curve showing the early to late stages of ageing in WT fish compared to tert−/− fish, highlighting the changes we identify at cellular, tissue, and functional levels with ageing and that are accelerated in the absence of telomerase, at different ages throughout their life course. (B) Table summarising the sequence of events we observe in the ageing brain and that are accelerated by telomerase depletion: Accumulation of lysosomal proteins (such as SA‐β‐Gal), increased number of macrophages, and increased anxiety‐like behaviour are already observed at the young age of 2–6 in tert−/− fish (but only at later ages in WT fish). Dysfunction at lysosomes and recruitment of immune cells are likely to contribute to a senescence phenotype by increasing senescence‐associated markers such as SASP and DDR, which are observed at 9–16 months in tert−/−. This is accompanied by increased immune activation (increased chitotriosidase activity) and BBB permeability at the same age, potentially as a consequence of increased inflammation and accumulation of cellular senescence. In turn, BBB leakiness is likely to lead to further recruitment of immune cells from the periphery, further exacerbating inflammation and BBB dysfunction in a positive feedback loop.

Acknowledgments
This image is the copyrighted work of the attributed author or publisher, and ZFIN has permission only to display this image to its users. Additional permissions should be obtained from the applicable author or publisher of the image. Full text @ Aging Cell