IMAGE

FIGURE 1

ID
ZDB-IMAGE-251210-32
Source
Figures for Martins et al., 2025
Image
Figure Caption

FIGURE 1

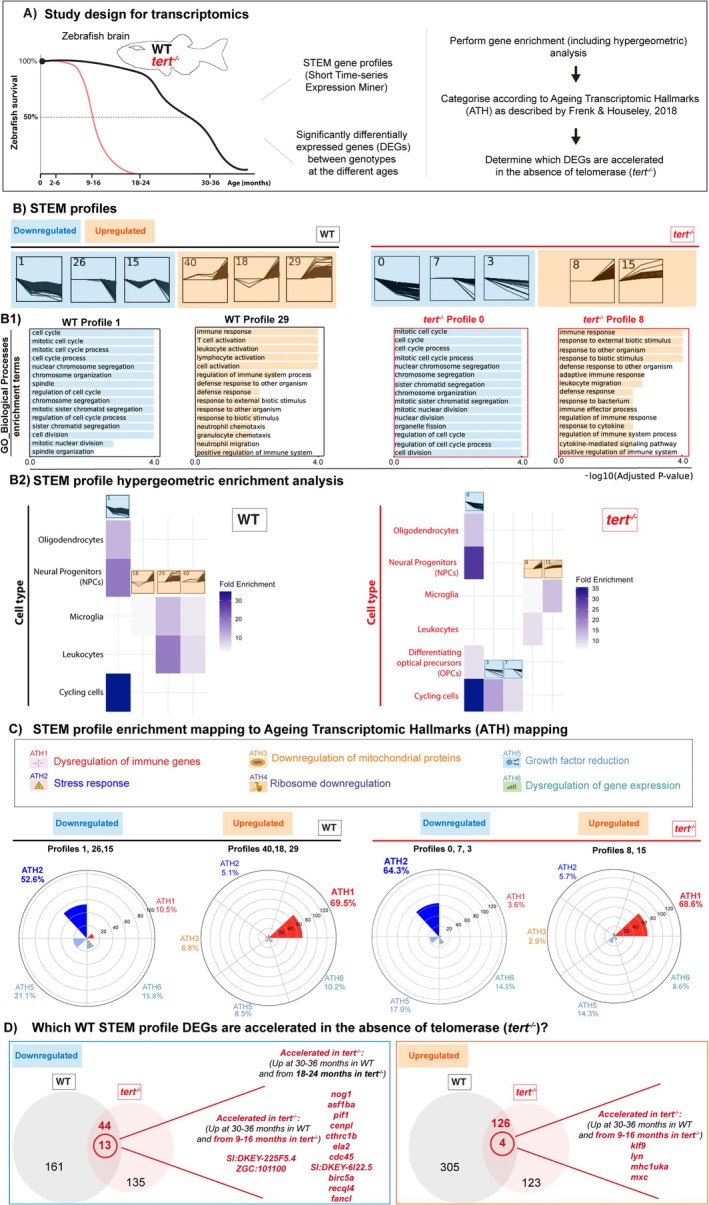
Transcriptomic signatures of ageing in the presence and absence of telomerase in the zebrafish brain. (A) Schematic figure of the study design for transcriptomics: RNA from whole brain tissue from young (2–6 months), young adult (9–16 months), middle aged (18–24 months) and old, (30–36 months) WT fish, and young (2–6 months), middle aged (9–16 months) and old (18–24 months) tert−/− fish was used for RNA sequencing. N = 3 per group. Transcriptomic alterations of ageing were analysed using two complementary approaches: STEM profiles and traditional DEG analysis between genotypes at different ages. Enrichment analysis and hypergeometric analysis were performed to identify the predominant pathways altered with ageing in the presence and absence of telomerase, and the DEGs were mapped to the ageing transcriptomic hallmarks (ATH). (B) Plots of the profiles identified by the STEM analysis (profiles containing down‐regulated genes in blue and profiles containing up‐regulated genes in orange) in both WT and tert−/− zebrafish brains, and (B1) top enrichment pathways (GOBP) identified in representative profiles. (B2) STEM profile hypergeometric enrichment analysis in WT and tert−/− brains identified which cell populations are mainly affected with ageing in the presence and absence of telomerase. (C) The genes identified by STEM analysis were then mapped to ATH. Plots show the proportion of genes mapped to each ATH, in both WT and tert−/− fish. (D) Venn diagrams highlight the genes identified in the STEM profiles of WT fish that are accelerated in the absence of telomerase (i.e., in tert−/− fish).

Acknowledgments
This image is the copyrighted work of the attributed author or publisher, and ZFIN has permission only to display this image to its users. Additional permissions should be obtained from the applicable author or publisher of the image. Full text @ Aging Cell