
- Title
-
Aged Zebrafish as a Spontaneous Model of Cardiac Valvular Disease
- Authors
- Bevan, L., Radford, J., Urquijo, H., Carr, J., Etheridge, A., Cross, S., Hezzell, M., Richardson, R.J.
- Source
- Full text @ Aging Cell
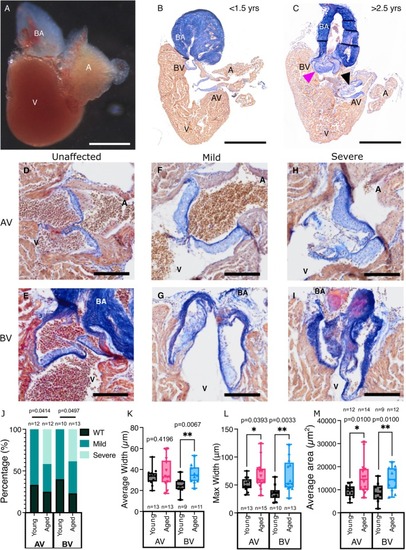
Morphological changes observed in adult zebrafish valves. (A) Image of a dissected heart from a 1‐year‐old zebrafish. (B, C) Overview images of sections of adult zebrafish hearts (< 1.5 years‐B; > 2.5 years‐C) stained with Acid Fuchsin Orange G (AFOG). The atrioventricular (AV) and bulboventricular (BV) valves are indicated. The magenta arrowhead in C indicates thickened leaflets in the BV and the black arrowhead highlights a cystic, nodular region in the AV of an aged zebrafish. (D–I) Higher magnification views of the AV (D, F, H) and BV (E, G, I) indicating examples of phenotypes assigned to the indicated severity for the qualitative scoring shown in J. (J) Qualitive scoring of the AV and BV from young and aged fish. (K–M) Quantification of the average width (K), maximum width (L) and average area (M) of individual leaflets of the AV and BV in young and aged fish. n numbers are indicated on all groups. A, atrium; BA, Bulbus arteriosus; V, ventricle. Statistical analysis: |
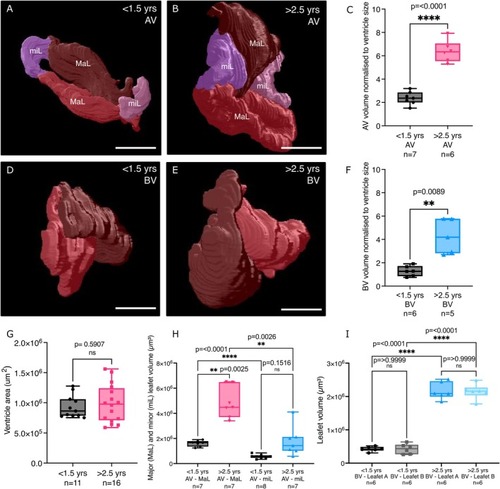
3D render views of adult zebrafish valves. (A–C) 3D render views (A, B) and quantification (C) showing the volume of the entire AV (leaflet volumes combined) in young (A, C) and aged (B, C) fish. (D–F) 3D render views (D, E) and quantification (F) showing the volume of the entire BV in young (D, F) and aged (E, F) fish. In both cases the valve volume is normalised to the ventricular area for each fish. (G) Quantification of ventricular area as measured from confocal imaging of cleared hearts. (H, I) Quantification of the combined volume of the major and minor leaflets of the AV (H) and individual leaflets of the BV (I) in young and aged fish. MaL, major leaflets; miL, minor leaflets. Statistical analysis: C, F, G = Welch's |
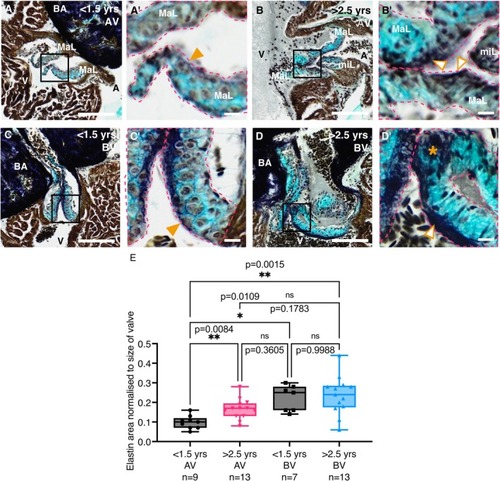
Phenotyping of young and aged zebrafish valves. (A–D) Images of RMP stained valves from young (A, C) and aged (B, D) fish. The AV is shown in A, B and the BV in C, D. (A′–D′) Higher magnification views of the boxed regions in A–D. Orange arrowheads in A′ and C′ denote the thin elastin layer within the atrialis/ventricularis. The open orange arrowheads in B′ and D′ denote the thickened elastin layer in the AV and BV, respectively and the asterisk in D′ indicates a region of disordered elastin. (E) Quantification of the amount of elastin staining, normalised to the area of all leaflets combined, in the AV (left) and BV (right) of young and aged fish. Individual leaflets are outlined with magenta dashed lines in A′–D′. A, atrium; BA, Bulbus arteriosus; MaL, major leaflet; miL, minor leaflet; V, ventricle. Statistical analysis: E, Brown‐Forsythe and Welch's ANOVA. Scale bars: A–D = 100 μm; A′–D′ = 10 μm. |
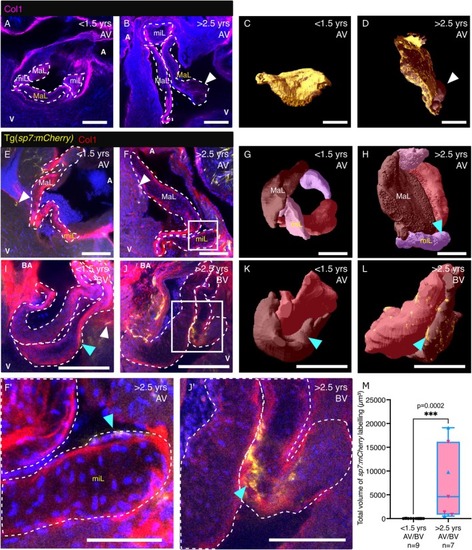
Collagen distribution and osteoblastic differentiation in young and aged zebrafish valves. (A–D) Images of cleared AVs (A, B) and 3D renders of a single leaflet (C, D) from young (A, C) and aged (B, D) zebrafish, labelled with an anti‐Collagen I antibody. The major leaflet (MaL) shown in C, D is marked in yellow on A, B, respectively. White arrowheads in B, D indicate cystic regions devoid of collagen. (E–H) Images (E, F, higher magnification in F′) and 3D renders (G, H) of the cleared AV labelled with an anti‐Collagen I antibody from young (E, G) and aged (F, H) Tg( |
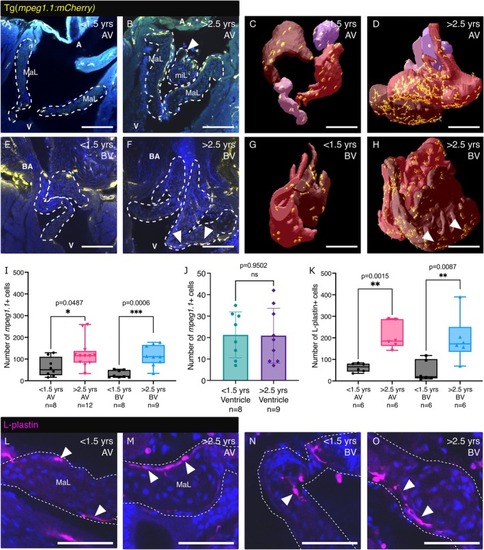
Changes in immune cell number in aged zebrafish valves. (A–D) Images (A, B) and 3D renders (C, D) of the cleared AV from young (A, C) and aged (B, D) Tg( |
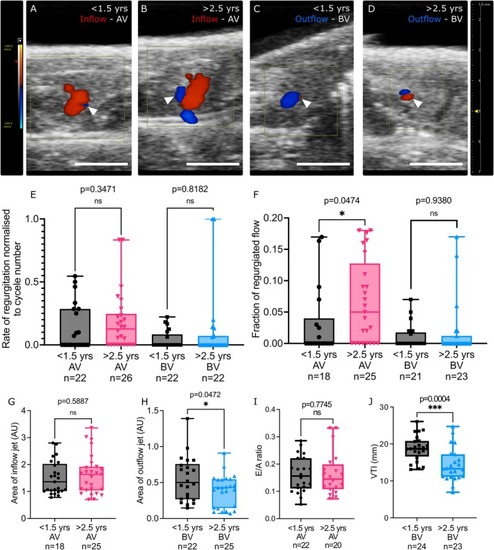
Functional changes in aged zebrafish hearts. (A–D) Example images from colour Doppler analysis revealing the inflow of blood through the AV (red—A, B) and outflow of blood through the BV (blue—C, D) in young (A, C) and aged zebrafish (B, D). Regurgitation is indicated by the opposite colour at the same anatomical region (white arrowheads in A–D). Anterior is to the left. (E, F) Quantification of the rate of regurgitation, normalised to cycle number (E) and the fraction of the regurgitated flow (F) observed at the AV and BV of young and aged zebrafish. (G, H) Area measurements of the maximal flow through the AV (G) and BV (H) in young and aged zebrafish. AU, arbitrary units. (I, J) Quantification of functional parameters of the AV (I) and BV (J) of young and aged zebrafish via pulse wave Doppler echocardiography. Statistical analysis: E, F, G, I = Mann Whitney‐ |