
|
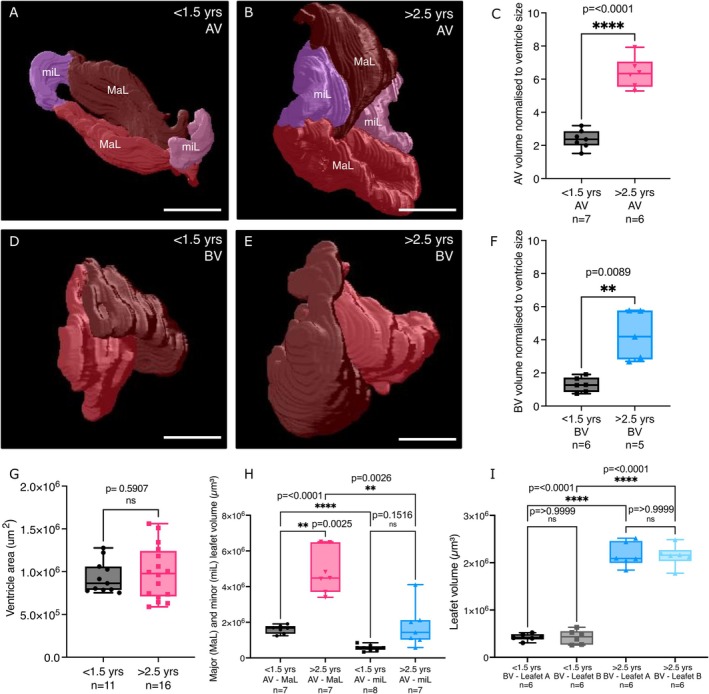
FIGURE 2
3D render views of adult zebrafish valves. (A–C) 3D render views (A, B) and quantification (C) showing the volume of the entire AV (leaflet volumes combined) in young (A, C) and aged (B, C) fish. (D–F) 3D render views (D, E) and quantification (F) showing the volume of the entire BV in young (D, F) and aged (E, F) fish. In both cases the valve volume is normalised to the ventricular area for each fish. (G) Quantification of ventricular area as measured from confocal imaging of cleared hearts. (H, I) Quantification of the combined volume of the major and minor leaflets of the AV (H) and individual leaflets of the BV (I) in young and aged fish. MaL, major leaflets; miL, minor leaflets. Statistical analysis: C, F, G = Welch's