
|
FIGURE 3
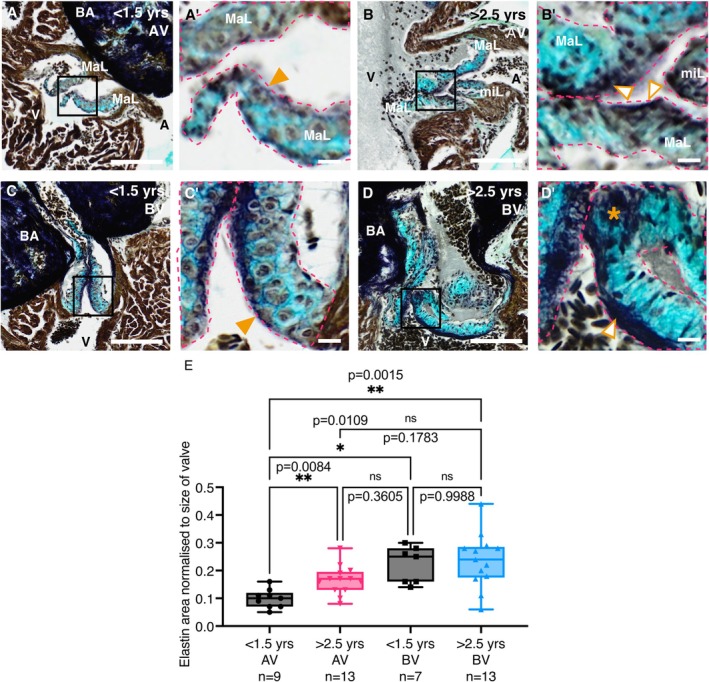
Phenotyping of young and aged zebrafish valves. (A–D) Images of RMP stained valves from young (A, C) and aged (B, D) fish. The AV is shown in A, B and the BV in C, D. (A′–D′) Higher magnification views of the boxed regions in A–D. Orange arrowheads in A′ and C′ denote the thin elastin layer within the atrialis/ventricularis. The open orange arrowheads in B′ and D′ denote the thickened elastin layer in the AV and BV, respectively and the asterisk in D′ indicates a region of disordered elastin. (E) Quantification of the amount of elastin staining, normalised to the area of all leaflets combined, in the AV (left) and BV (right) of young and aged fish. Individual leaflets are outlined with magenta dashed lines in A′–D′. A, atrium; BA, Bulbus arteriosus; MaL, major leaflet; miL, minor leaflet; V, ventricle. Statistical analysis: E, Brown‐Forsythe and Welch's ANOVA. Scale bars: A–D = 100 μm; A′–D′ = 10 μm.