FIGURE SUMMARY
Title

Prostaglandin Analogs and Eupatilin as Treatments for Nephronophthisis

Authors
Tata, A., Rocha, G., Hureaux, M., Serafin, A.S., Porée, E., Menguy, L., Goudin, N., Cagnard, N., Gréau, L., Fila, M., Briseño-Roa, L., Annereau, J.P., Saunier, S., Benmerah, A.
Source
Full text @ Kidney Int Rep

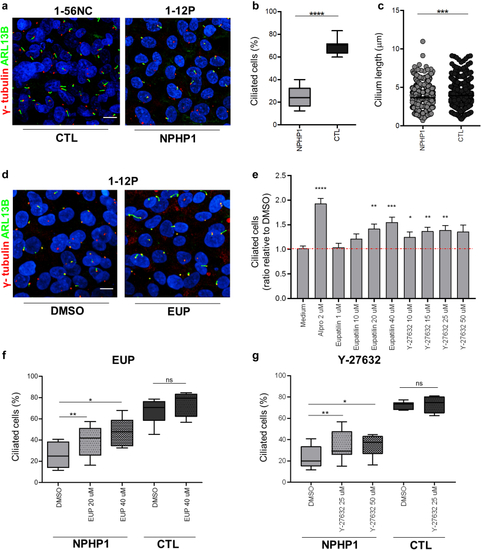
Eupatilin and ROCK inhibitors rescue ciliogenesis defects in NPHP1 URECs. (a) Control (1-56NC) and NPHP1 (1-12P) URECs grown in ciliogenesis conditions for 5 days at nonpermissive temperature (39 °C) were fixed and stained for primary cilia (ARL13B, green) and basal bodies (γ- tubulin, red). (b) Ciliogenesis in NPHP1 (1-12P and 1-03P) and CTL (1-56NC) URECs were quantified using Harmony software and expressed as percentage of ciliated cells shown using a box-and-whisker plot (n = 5–11 experiments). Mixed linear regression model with quasibinomial penalization taking into account the correlation of observations coming from the same individuals using a random effect on the cell line: ∗∗∗∗P < 0.0001. (c) Cilium length in NPHP1 (1-12P and 1-03P) and CTL (1-56NC) URECs length was quantified as explained in the Methods and expressed in μm using a dot-plot (n = 3 experiments). Unpaired 2-tailed t test: ∗∗∗P < 0.001. (d) NPHP1 URECs (1-12P) treated with either DMSO (0.04%) or 20 μM EUP for 48 hours were fixed and stained as in (a) for primary cilia (ARL13B, green) and basal body (γ-tubulin, red). (e) Ciliogenesis in 1.12P and 1.03P NPHP1 URECs treated for 48 hours with either alprostadil (Alpro), Eupatilin (EUP) or ROCK inhibitor (Y-27632) was expressed as the ratio to control DMSO-treated cells. Mean ± SEM (n = 4–7 experiments); paired 2-tailed t test: ∗∗∗∗ P < 0.0001, ∗∗∗ P < 0.001, ∗∗ P < 0.01, ∗ P < 0.05. (f and g) Ciliogenesis in URECs derived from CTL (1-56NC) and NPHP1 patients (1-12P and 1-03P) treated for 48 hours with DMSO or EUP (20 and 40 μM; n = 4–6 experiments per cell line; (f) or Y-27632 (25 and 50 μM; n = 2–5 experiments per cell line) was quantified similarly as in (b). ∗P < 0.05,∗∗ P < 0.01. Scale bars 10 μm. CTL, control; EUP, DMSO, dimethyl sulfoxide; Eupatilin; EUP, Eupatilin; ns, not significant; UREC, urinary renal epithelial cell.

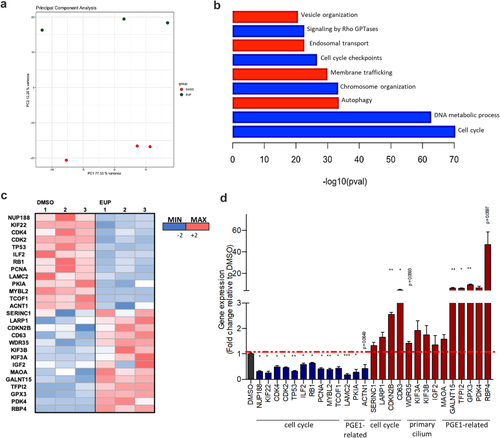
Transcriptomic analyses reveal the cellular pathways modulated in response to Eupatilin treatment. (a) Principal component analysis showing separation between the EUP-treated URECs and the DMSO-treated by PC2 variance. (b) Pertinent down (blue) or up (red) regulated pathways or relevant processes involving ciliary modulators dysregulated in NPHP1 URECs upon 24 hours of 20 μM EUP treatment were highlighted using Metascape. (c) Heatmap generated from qPCR results of 27 selected genes from RNA-seq dataset of NPHP1 URECs DMSO versus EUP. (d) RT-qPCR validating the effect of EUP treatment on the expression of 27 selected dysregulated genes in NPHP1 URECs. Mean ± SEM (n 0 = 3 experiments). Paired 2-tailed t test: ∗∗∗P < 0.001, ∗∗P < 0.01, ∗P < 0.05. Bars indicate mean ± SEM. DMSO, dimethyl sulfoxide; EUP, Eupatilin; ns, not significant; UREC, urinary renal epithelial cells.

NPHP5 URECs show ciliogenesis and ciliary composition defects. (a–c) Control (1-56NC) and NPHP5 URECs (2.05P1, 2.05P2) grown in ciliogenesis conditions fixed and stained for primary cilia (ARL13B, green) and basal bodies (γ- tubulin, red) markers (a). (b) Ciliogenesis and (c) cilium length were quantified as in Figure 1. (b) n = 4 experiments; mixed linear-regression model with quasibinomial penalization: ∗∗∗P < 0.001. (c) n = 3 experiments; unpaired 2-tailed t test: ∗∗∗∗P < 0.0001; ∗P < 0.05. (d) Ciliated control (1.56.NC) and NPHP5 (2.05P1) URECs were fixed and stained for basal body and axoneme (GT335, red) and for TMEM67 (green), which is a marker of the transition zone (arrows). (e) TMEM67 staining intensity at the transition zone was quantified as detailed in Methods. n = 2 experiments; unpaired 2-tailed t test: ∗P < 0.05. (f) Ciliated control (1.56.NC) and NPHP5 (2.05P1) URECS were fixed and stained for basal body and axoneme (GT335, red) and for INPP5E (green). (g) Intensity of INPP5E staining in cilia was quantified as explained in Methods. n = 3 experiments; unpaired 2-tailed t test: ∗∗P < 0.01, ∗∗∗P < 0.001. Scale bars 10 μm. UREC, urinary renal epithelial cells.

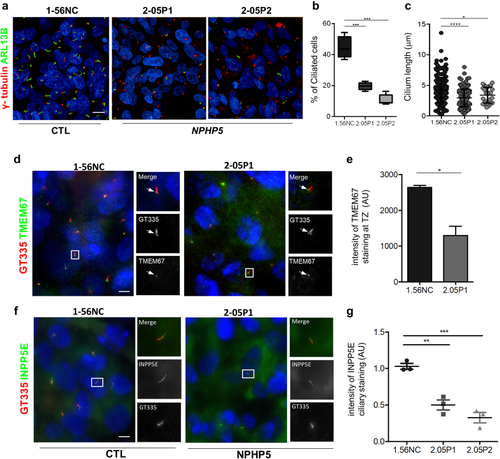
Ciliogenesis defects in NPHP5 URECs are rescued by Alprostadil/PGE1. (a) Immunofluorescence for primary cilia (ARL13B, green) and basal bodies markers (γ- tubulin, red) of NPHP5 URECs (2.05P1, 2.05P2) treated with 0.04% DMSO or 2 μM alprostadil (Alpro) for 48 hours. Scale bar 10 μm. (b) Ciliogenesis was quantified in control (1.56NC), NPHP5 (2.05P1, 2.05P2) and NPHP1 (1.12P) URECs treated with either DMSO (0.04%) or 2 μM alprostadil (Alpro), were fixed and stained similarly as in (a) (n = 4 experiments). Mixed linear regression with quasi-binomial penalization: ∗∗∗P < 0.001, ∗∗P < 0.01, ∗P < 0.05. (c) Cilium length was quantified as in Figure 1 in control (1.56NC) and NPHP5 (2.05P1, 2.05P2) URECs treated with 0.04% DMSO (-) or 2μM alprostadil (Alpro). n = 4 experiments; paired 2-tailed t: ∗∗∗∗P < 0.0001, ∗∗∗P < 0.001, ∗∗P < 0.01. DMSO, dimethyl sulfoxide; UREC, urinary renal epithelial cells.

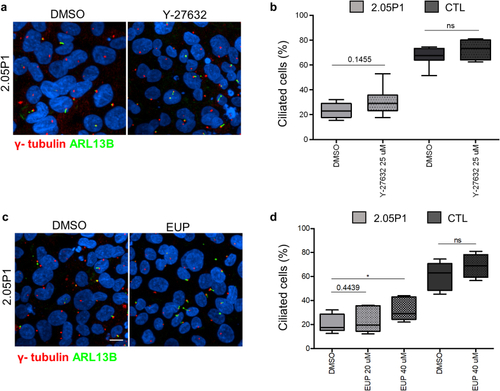
Eupatilin but not Rock inhibitor increases ciliation in NPHP5 URECs. (a–d) Control (1.56NC) and NPHP5 (2.05P1) URECs treated with DMSO (0,04%) or either ROCK inhibitor (Y-27632i, 25 μM; a and b) or Eupatilin (EUP, 20 μM and/or 40 μM; c and d) were fixed and stained primary cilia (ARL13B, green) and basal body markers (γ- tubulin, red; a and c). Ciliogenesis was quantified similarly as in Figure 1 (EUP, b; Y-27632, d). (b) n = 3 to 5 experiments, ∗∗ P < 0.05. (d) n =2 to 4 experiments. The statistical analysis were performed using R script for mixed linear-regression model with quasibinomial penalization. DMSO, dimethyl sulfoxide; EUP, Eupatilin; UREC, urinary renal epithelial cells.

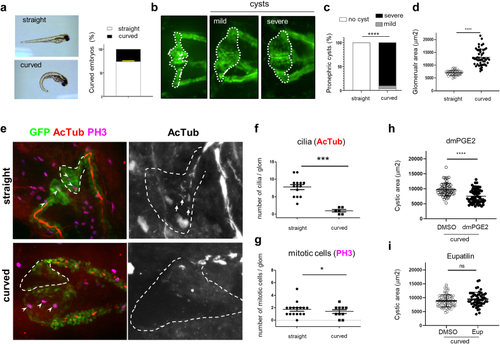
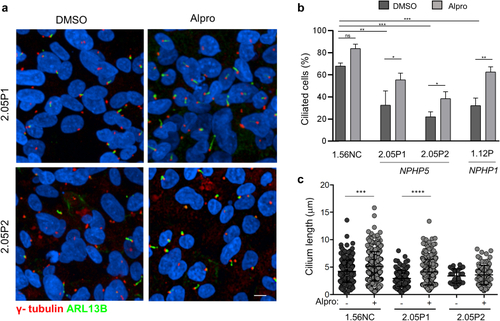
PGE2, but not Eupatilin, shows beneficial effect on cysts size in traf3ip1 mutant fish. (a) Representative pictures obtained after crossing m649-GFP fish (48 hpf) with an example of straight (up) and curved (down) embryos. The curvature phenotype was quantified (n = 8 experiments). (b) Representative pictures of the GFP-expressing pronephros with, from left to right: wild-type, mild (unilateral or small), or severe (bilateral) cystic pronephros. The region of the pronephros used to quantify the cyst area is indicated by a dotted white line. (c) Quantification of cyst severity score in straight and curved embryos (n = 4 experiments, chi-square test: ∗∗∗∗P < 0.0001). (d) Quantification of cyst area measured as explained in (b) for straight and curved embryos (n = 4 experiments; unpaired t test with Welch's correction: ∗∗∗∗P < 0.0001; error bars representing mean ± SD. (e) Straight (upper panels) and curved (lower panels) m649-GFP embryos were fixed and stained for cilia (acetylated-αtubulin, AcTub; red) and mitotic cells (phospho-histone-H3, PH3; purple). Representative color images are shown on the left. The areas surrounded by dotted lines represent one side of the glomerulus with the initial part of the proximal tubule based on GFP staining. On the right, zoomed (×2.33) views of the same samples are shown for AcTub only. White arrowheads on the left and arrows on the right pictures indicate mitotic cells and cilia, respectively. Scale bars: 20μm. (f) Quantification of cilia number per glomerulus for straight and curved embryos. Unpaired t test with Welch’s correction: ∗∗∗∗ P < 0.0001. (g) Quantification of mitotic cells number per glomerular region for straight and curved embryos. Mann-Whitney test: ∗P < 0.05. (h and i) m649-GFP embryos were treated with DMSO, dimethyl-PGE2 (dmPGE2; 100 μM), or Eupatilin (2.5 μM) starting at 24 hpf. Quantification of the effects of treatments on cyst area (dmPGE2: Mann-Whitney test; ∗∗∗∗P < 0.0001; Eupatilin: unpaired t test with Welch’s correction: ns P > 0.05). DMSO, dimethyl sulfoxide; EUP, Eupatilin.

Acknowledgments
This image is the copyrighted work of the attributed author or publisher, and ZFIN has permission only to display this image to its users. Additional permissions should be obtained from the applicable author or publisher of the image. Full text @ Kidney Int Rep