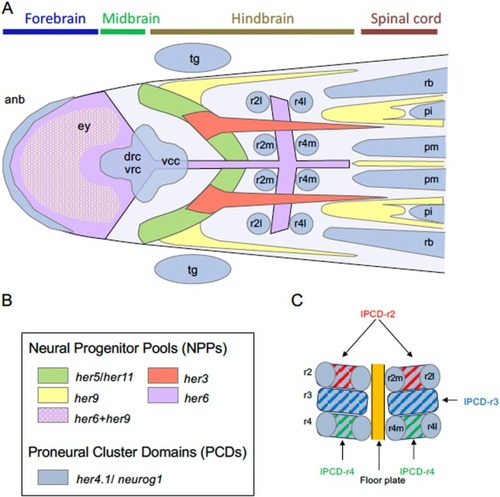
Summary of the neurogenesis pattens in the developing neural plate in zebrafish. (A) Schematic diagram of the anterior neural plate, showing distribution of proneural cluster domains (PCDs) and neural progenitor pools (NPPs) marked by various her genes (Stigloher et al. 2008). The expression of her9 in the floor plate and midbrain‐hindbrain boundary (MHB) region is omitted to avoid confusion (Latimer et al. 2005). Doral views with anterior to the left. anb, anterior neural boundary; drc, dorso‐rostral cluster; ey, eye field; fb, forebrain; mb, midbrain; pi, primary spinal interneurons; pm, primary spinal motor neurons; r2l, lateral neurons in rhombomere 1/2; r2m, motoneurons in rhombomere 1/2; rb, spinal sensory neurons (Rohon‐Beard neurons); tg, trigeminal ganglion; vcc, ventro‐caudal cluster; vrc, ventro‐rostral cluster. (B) Color codes used in panel A. (C) Patterns of PCDs and NPPs in the hindbrain. Distribution of PCDs (r2m, r2l, r4m, r4l) and inter‐PCDs (IPCDs) in the rhombomere 3–5 region (IPCD‐r3–IPCD‐r5) are shown schematically.

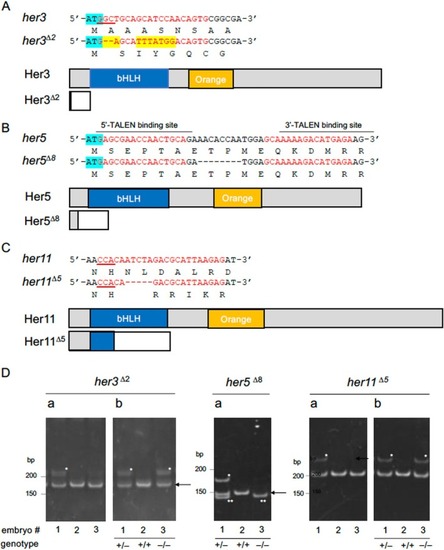
Structures of the mutant her genes established in the current study. (A–C) Mutations introduced into Notch‐independent her genes by genome editing. Small indels were introduced into the N‐termini (her3, her5) or bHLH (her11) domains using CRISPR/Cas9 (her3, her11) or TALEN (her5). The target base sequences (red) and corresponding amino acid sequences are shown above the gene schematics. PAM sequences are underlined, and start codons are marked with light blue. In her3, base substitution (yellow) and a small deletion were observed. Wild‐type and disrupted coding sequences due to frameshifts are shown with gray and white boxes, except for bHLH domains and Orange domains that are shown with blue and orange boxes, respectively. In the her3 mutant line, almost the entire coding region was missing due to a frameshift immediately after the start codon. In her5 mutants, an 8‐bp deletion resulted in a stop codon at position 29. In the her11 mutant, a 5‐bp deletion occurred in the N‐terminal portion of the bHLH domain. (D) Genotyping of her mutants by the HMA method (examples). Da. Genomic DNA from embryos (#1–#3) was PCR amplified using primer pairs flanking the target sites and analyzed by PAGE. Band shifts (asterisks) indicate heterozygotes, while no shift indicates WT or homozygotes. In her5 mutants, WT and homozygotes were discriminated by size reduction (double asterisks). For her3/her11 mutants, PCR products were re‐annealed with WT genomic DNA and analyzed by second PAGE (Db). Band shifts confirm homozygosity.

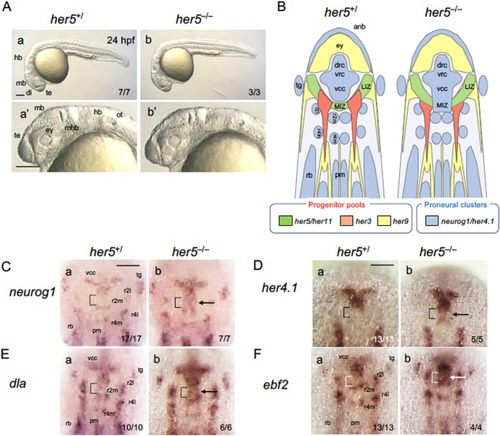
Phenotypes of her5 mutants in the developing brain. (A) Morphology of her5 mutants at 24 hpf. Live embryos from heterozygous mating (her5+/Δ8) were photographed and genotyped. Lateral views of whole embryos (a, b) and heads (a′, b′) are shown with anterior to the left and dorsal to the top. Numbers of embryos with each phenotype and total scored embryos are indicated. Scale bars, 200 μm. (B) Schematic comparison of PCD gene expression in wild‐type (WT, left) and her6 homozygotes (right). Dorsal views (anterior top). (C–F) Expression of proneural cluster domain (PCD)‐related genes in her5 mutants. WISH staining was performed at the bud stage, followed by imaging and genotyping. Dorsal views of the midbrain‐hindbrain region are shown with anterior to the top; whole‐embryo views are shown in Figure S2A. Arrows mark ectopic expression in MIZ (brackets). Numbers of the embryos with the indicated expression patterns and total scored embryos are shown in the bottom‐right. her5+/+ and her5+/− embryos showed identical phenotypes and were grouped as her5+/, and scored accordingly; images show WT (her5+/+) embryos as representatives. Scale bars, 100 μm. di, diencephalon; hb, hindbrain; LIZ, lateral intervening zone; mhb, midbrain‐hindbrain boundary; mb, midbrain; MIZ, medial intervening zone; ot, otocyst; ov, optic vesicle; te, telencephalon. For the remaining abbreviations, see the legends to Figures 1 and 3.

EXPRESSION / LABELING:
Genes:
Fish:
Anatomical Term:
Stage: Bud
PHENOTYPE:
Fish:
Observed In:
Stage Range: Bud to Prim-5

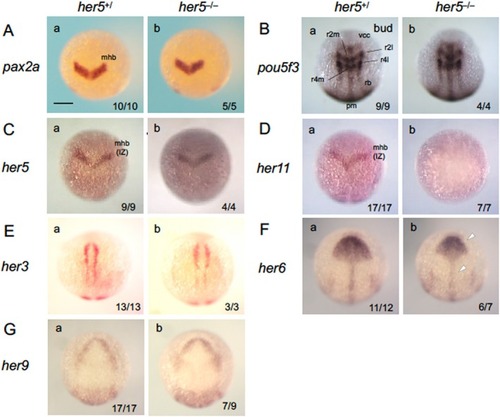
Expression of brain regionalization genes and her genes in her5 mutant embryos. Embryos from heterozygous mating (her5+/Δ8) were examined for the expression of MHB‐forming genes and her genes at the bud stage by WISH, followed by genotyping. Open arrowheads show weak downregulation. See the legends to Figures 1 and 3 for abbreviations. Numbers of the embryos with the indicated expression patterns and total scored embryos are shown in the bottom‐right. her5+/− embryos were indistinguishable from her5+/+ embryos. Thus, both were scored together and referred to as her5+/. Images for her5+/+ embryos are shown as representatives. Scale bar, 200 μm.

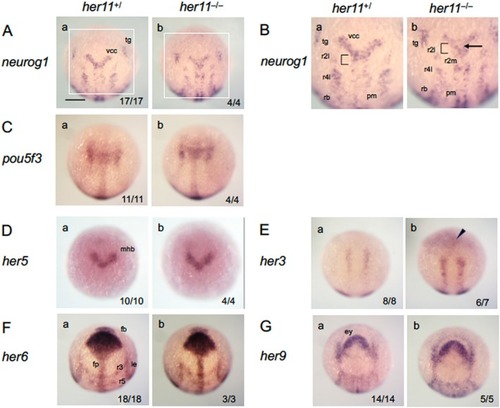
Phenotypic analysis of her11 mutant embryos. Embryos from heterozygous mating (her11+/Δ5) were examined for the expression of neurog1 (A, B), pou5f3 (C), and her genes (D–H) by WISH and photographed, followed by genotyping. A, B. For neurog1 expression, boxed areas in A are enlarged in B. Arrows mark ectopic expression in MIZ (brackets). Solid arrowheads in B show weak upregulation. See the legends to Figures 1 and 3 for abbreviations. Numbers of the embryos with the indicated expression patterns and total scored embryos are shown in the bottom‐right. her11+/+ and her11+/− embryos showed identical phenotypes and were grouped as her11+/, and scored accordingly; images show wild‐type (her11+/+) embryos as representatives. Scale bars, 200 μm.

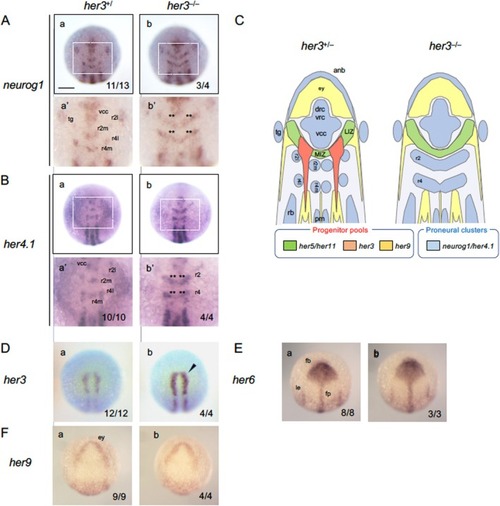
Phenotypic analysis of her3 mutant embryos. (A) Embryos from heterozygous mating (her3+/Δ2) were examined for the expression of neurogenesis‐related (A, B) and Notch‐independent her (D–G) genes by WISH, followed by genotyping. For each gene, boxed areas are enlarged below the whole views. Double asterisks (**) indicate ectopic expression in IPCD‐r2/IPCD‐4. Solid arrowheads show weak upregulation. Numbers of the embryos with the indicated expression patterns and total scored embryos are shown in the bottom‐right. her3+/+ and her3+/− embryos showed identical phenotypes and were grouped as her3+/, and scored accordingly; images show wild‐type (WT, her3+/+) embryos as representatives. Scale bars, 200 μm. (C) Schematic diagram, showing normal and ectopic neurogenesis observed in the IPCD in r1/2 (IPCD‐r2) and in r4 (IPCD‐r4) in WT embryos and her3 homozygotes, respectively. See the legends to Figures 1 and 3 for abbreviations.

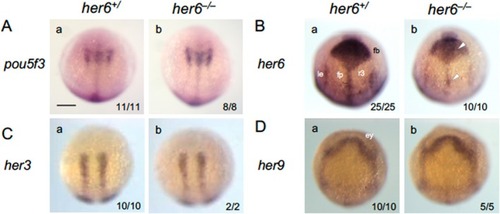
Expression of Notch‐independent her genes in her6 mutants. Embryos obtained by heterozygous mating of her6 mutants (her6+/Δ5) were examined for the expression of Notch‐independent her genes by WISH, followed by genotyping. Open arrowheads show weak downregulation. Numbers of the embryos with the indicated expression patterns and total scored embryos are shown in the bottom‐right. her6+/− embryos were indistinguishable from her6+/+ embryos, and both were scored together and referred to as her6+/. Images for wild‐type (her6+/+) embryos are shown as representatives. fp, floor plate; le, lateral ectoderm. See the legends to Figures 1 and 3 for other abbreviations. Scale bars, 200 μm.

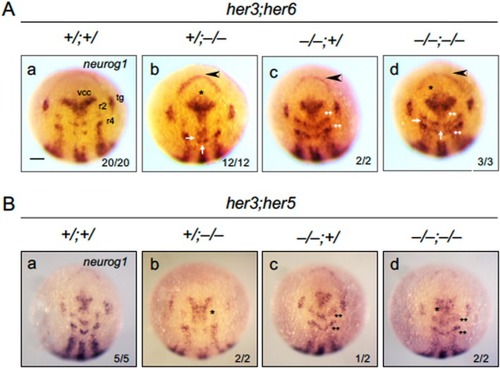
Abnormal neurogenesis in her compound mutants revealed by the expression of neurog1. The expression of neurog1 was examined by WISH in embryos from mating between her3/her6 double heterozygote fish (A, her3+/Δ2; her6+/Δ5) or her3/her5 double heterozygote fish (B, her3+/Δ2; her5+/Δ8) at the bud stage, photographed, and then genotyped. Dorsal views with anterior to the top. Numbers of embryos with the indicated expression patterns and the numbers of total scored embryos are shown in the bottom right. See the text for the symbols, ‘+/;+/’, ‘+/;−/−’, ‘−/−;+/’, and ‘−/−;−/−’). (A) Arrowheads indicate increased expression in the anterior‐most portion of the neural plate, thin horizontal arrows indicate ectopic expression in the r3 region (m‐IPCD‐r3), thick vertical arrows mark md‐IPCD‐r3/5, and single asterisks (*) indicate ectopic expression around drc and vrc. Ectopic expression in IPCD‐r2/IPCD‐r4 is indicated by double asterisks (**). (B) Ectopic expression in MIZ and in IPCD‐r2/IPCD‐4 is marked with single and double asterisks, respectively. For abbreviations, see the legends to Figures 1 and 3. Scale bar, 200 μm.

Acknowledgments
This image is the copyrighted work of the attributed author or publisher, and ZFIN has permission only to display this image to its users. Additional permissions should be obtained from the applicable author or publisher of the image. Full text @ Genesis