IMAGE

FIGURE 1

ID
ZDB-IMAGE-250603-36
Source
Figures for Ohyanagi et al., 2025
Image
Figure Caption

FIGURE 1

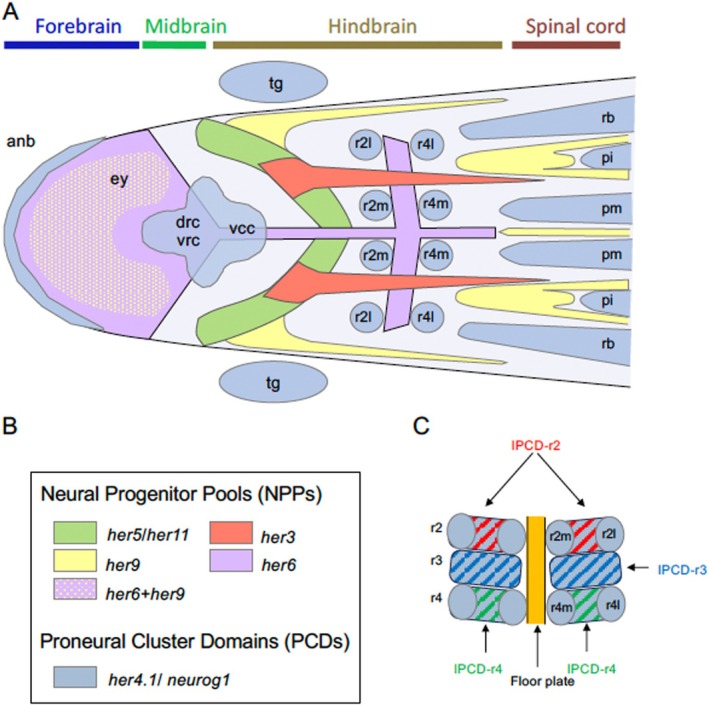
Summary of the neurogenesis pattens in the developing neural plate in zebrafish. (A) Schematic diagram of the anterior neural plate, showing distribution of proneural cluster domains (PCDs) and neural progenitor pools (NPPs) marked by various her genes (Stigloher et al. 2008). The expression of her9 in the floor plate and midbrain‐hindbrain boundary (MHB) region is omitted to avoid confusion (Latimer et al. 2005). Doral views with anterior to the left. anb, anterior neural boundary; drc, dorso‐rostral cluster; ey, eye field; fb, forebrain; mb, midbrain; pi, primary spinal interneurons; pm, primary spinal motor neurons; r2l, lateral neurons in rhombomere 1/2; r2m, motoneurons in rhombomere 1/2; rb, spinal sensory neurons (Rohon‐Beard neurons); tg, trigeminal ganglion; vcc, ventro‐caudal cluster; vrc, ventro‐rostral cluster. (B) Color codes used in panel A. (C) Patterns of PCDs and NPPs in the hindbrain. Distribution of PCDs (r2m, r2l, r4m, r4l) and inter‐PCDs (IPCDs) in the rhombomere 3–5 region (IPCD‐r3–IPCD‐r5) are shown schematically.

Acknowledgments
This image is the copyrighted work of the attributed author or publisher, and ZFIN has permission only to display this image to its users. Additional permissions should be obtained from the applicable author or publisher of the image. Full text @ Genesis