
- Title
-
X-linked myopathy with excessive autophagy: characterization and therapy testing in a zebrafish model
- Authors
- Huang, L., Simonian, R., Lopez, M.A., Karuppasamy, M., Sanders, V.M., English, K.G., Fabian, L., Alexander, M.S., Dowling, J.J.
- Source
- Full text @ EMBO Mol. Med.
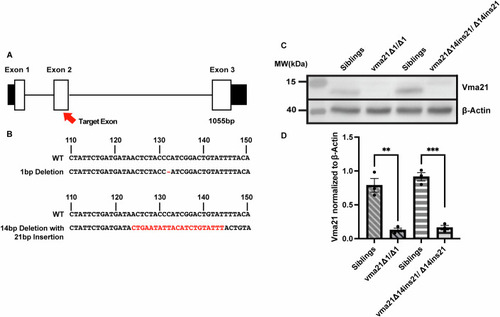
Generation and validation of ( |
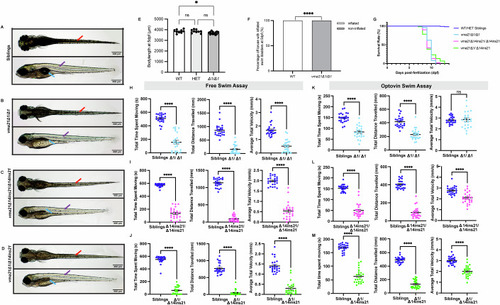
Representative light microscopy images of ( |
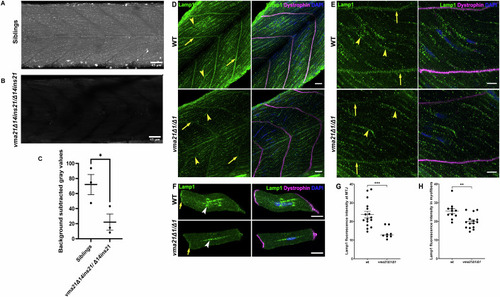
Lysosomal acidification is impaired in Representative images of ( |
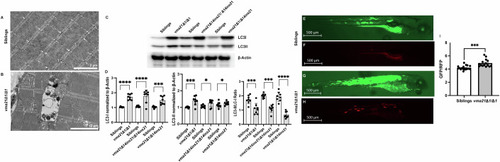
Aberrant autophagy in Representative electron micrographs from ( |
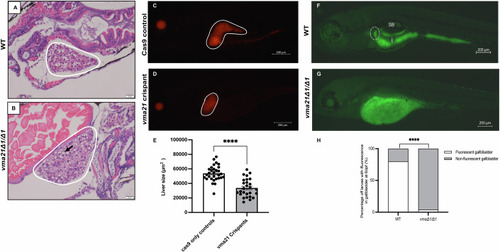
Representative H&E staining of ( |
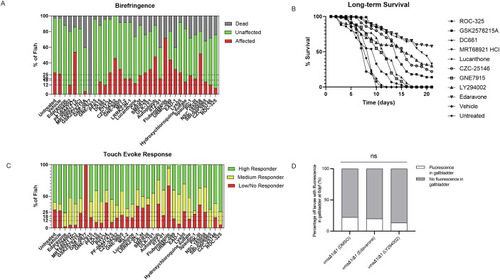
Autophagy antagonist drug library screening identifies corrective molecules in the ( PHENOTYPE:
|