|
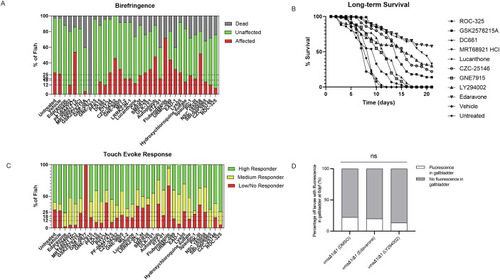
Autophagy antagonist drug library screening identifies corrective molecules in the vma21 mutant zebrafish. (A) Results from birefringence assessment of vma21Δ14ins21 heterozygote in-cross matings with zebrafish larvae incubated in autophagy library drug compounds. Dorsal muscle birefringence assessments of the drug-treated vma21Δ14ins21/Δ14ins21 homozygote zebrafish larvae offspring. Zebrafish were scored as dead (gray bars; no detectable heartbeat), affected (red bars; showing at least one area of poor birefringence), or unaffected (green bars; no birefringence). Dashed lines shown at 25%, 18%, and 12.5% target range for lead compound advancement. (B) Long-term survivability assessment of eight autophagy antagonists tested in the vma21Δ14ins21/Δ14ins21 homozygote mutant zebrafish advanced from the first pass short-term screen, LY294002 (positive control), and vehicle and untreated (negative controls). (C) Touch-evoke response measured with % of fish shown and groupings of high responders (green bars), medium responders (yellow bars), and low/non-responders (red bars). Compounds are administered into vma21Δ14ins21/Δ14ins21 homozygote mutant zebrafish at 1 dpf and drug water was changed every other day over a 21-day time period. The compounds include: ROC-325, GSK2578215A, DC661, MRT68921 HCl, Lucanthone, CZC-25146, GNE7915, edaravone, and LY294002 administered at 2.5 µM. Vehicle and untreated controls are also shown. One hundred (n = 100) vma21Δ14ins21/Δ14ins21 mutant fish were assessed over 3 independent trials. Compounds were later validated in the vma21D1/D1 mutant zebrafish. (D) Percentage of larvae with fluorescence in the gallbladder at 6 dpf following feeding with BODIPY as a measure of bile acid flux. n = 10–22/group. Data represented as mean ± SEM. Not significant (ns; P > 0.05, Fisher’s exact test). Source data are available online for this figure.
|