IMAGE

Figure 5

ID
ZDB-IMAGE-250411-15
Source
Figures for Huang et al., 2025
Image
Figure Caption

Figure 5 vma21 mutants have hepatic lipid accumulation, smaller liver size, and disrupted bile flux.

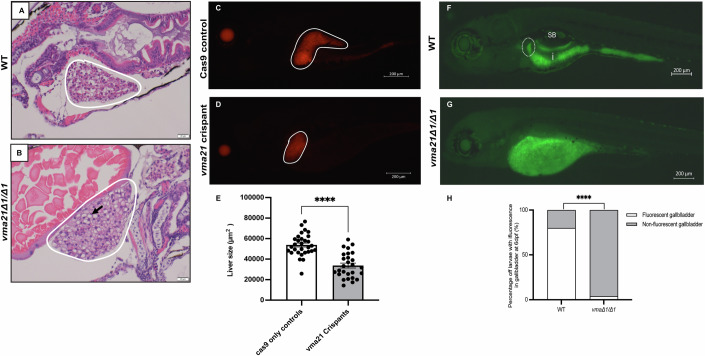
Representative H&E staining of (A) WT and (B) ma21Δ1/Δ1 mutants at 6 dpf. The liver is outlined in white and the black arrow highlights a lipid droplet. n = 6 per group. Representative fluorescent images of the liver of (C) Cas9-only and (D) vma21 crispants injected into the Tg(Fabp:mCherry) transgenic line at 5 dpf. The fluorescent red liver is outlined in white. (E) Quantification of liver size at 6 dpf. n = 27–30/group. Data represented as mean ± SEM. Significance at ****P < 0.0001 (unpaired two-tailed t test). Representative fluorescent images of (F) wild-type (WT) and (G) vma21Δ1/Δ1 mutants (homozygous for a 1 base pair (bp) deletion in vma21) at 6 days post fertilization (dpf) fed a BODIPY diet. The gallbladder is outline by the white dotted line. ×32 Magnification, scale bar: 200 mm. SB swim bladder, i intestine. (H) Quantification of the percentage of larvae with fluorescence in the gallbladder at 6 dpf. n = 26-29/group. Data represented as mean ± SEM. Significance at ****P < 0.0001 (Fisher’s exact test). Source data are available online for this figure.

Acknowledgments
This image is the copyrighted work of the attributed author or publisher, and ZFIN has permission only to display this image to its users. Additional permissions should be obtained from the applicable author or publisher of the image. Full text @ EMBO Mol. Med.