
- Title
-
Targeting oxidative stress-induced lipid peroxidation enhances podocyte function in cystinosis
- Authors
- Berlingerio, S.P., Bondue, T., Tassinari, S., Siegerist, F., Ferrulli, A., Lismont, C., Cairoli, S., Goffredo, B.M., Ghesquière, B., Fransen, M., Endlich, N., Oliveira Arcolino, F., Bussolati, B., van den Heuvel, L., Levtchenko, E.
- Source
- Full text @ J Transl Med
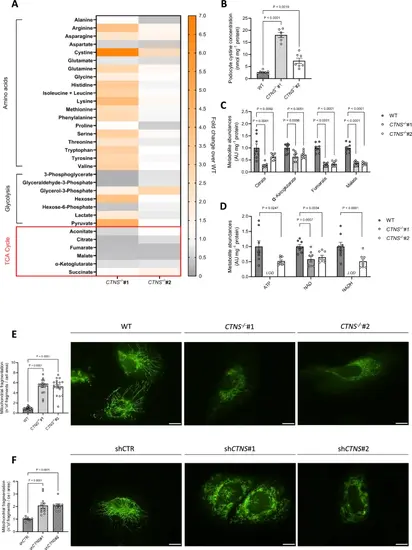
Cystinosis podocytes display impaired mitochondrial metabolism and a fragmented mitochondrial network. a. Intracellular metabolite levels in CTNS−/−#1 and CTNS−/−#2 normalized to WT podocytes measured by LC–MS (n = 3 biological experiments, n ≥ 2 technical replicates). b. Cystine concentrations in WT, CTNS−/−#1, and CTNS−/−#2, expressed as nmol mg⁻1 protein. (n ≥ 6 biological experiments, n = 2 technical replicates). Statistical analysis: Dunnett’s one-way ANOVA. (c, d) c. Citrate, α-ketoglutarate, fumarate, and malate levels in CTNS−/−#1 and CTNS−/−#2, normalized to WT podocytes and protein (mg⁻1), d. ATP, NAD, and NADH levels in CTNS−/−#1 and CTNS−/−#2, normalized to WT podocytes and protein (mg⁻1). (n = 3 biological experiments, n ≥ 2 technical replicates). Statistical analysis: linear mixed model for each metabolite. AU = arbitrary units. LOD = below the limit of detection. Each dot represents a technical replicate. (e, f) Mitochondrial fragmentation in cells expressing the mitochondrial roGFP2 redox sensor. Left panel: quantification of mitochondrial fragmentation (number of fragments normalized to cell area) in e. CTNS−/−#1 and CTNS−/−#2 normalized to WT podocytes; f. shCTNS#1 and shCTNS#2 normalized to shCTR. (n = 4 biological experiments, n ≥ 4 technical replicates). Statistical analysis: linear mixed model. Each dot represents an individual cell measurement. Right panels: representative images of mitochondrial networks. Scale bar: 20 μm. Unless noted, each dot represents a biological experiment |
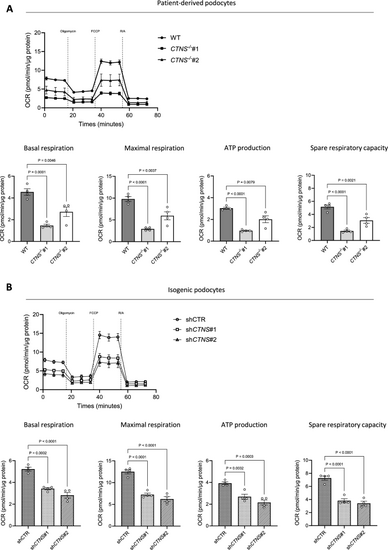
Cystinosis podocytes reveal decreased respiratory activity. Seahorse assay. (a, b) Upper panel: Oxygen consumption rate (OCR) in a. WT, CTNS−/−#1, and CTNS−/−#2, and b. shCTR, shCTNS#1, and shCTNS#2 at baseline and following injection of oligomycin, FCCP, and rotenone/antimycin A (R/A). Final concentrations: oligomycin (1.5 μM), FCCP (2 μM), rotenone (1.25 μM) and antimycin A (2.5 μM). Lower panel: quantification of basal respiration, maximal respiration, ATP production, and spare respiratory capacity in a. WT, CTNS−/−#1, and CTNS−/−#2, and b. shCTR, shCTNS#1, and shCTNS#2 (n = 4 biological experiments, n = 10 technical replicates). Statistical analysis: Dunnett’s one-way ANOVA. For each experiment, values were normalized to protein levels. Each dot represents a biological experiment |
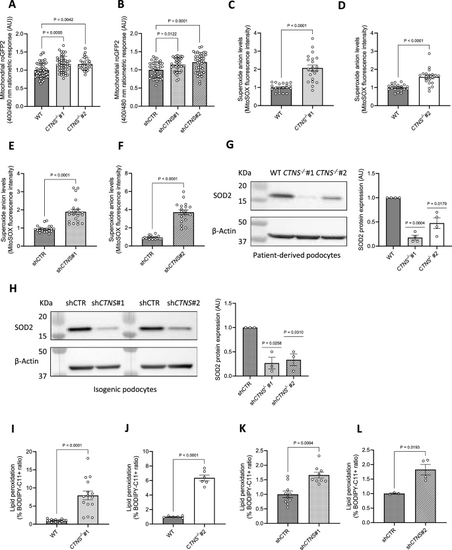
Cystinosis podocytes show an increased mitochondrial glutathione redox state and elevated lipid peroxidation. (a, b) In situ quantification of the mitochondrial glutathione redox potential in a. CTNS−/−#1 and CTNS−/−#2 normalized to WT podocytes, b. shCTNS#1 and shCTNS#2 normalized to shCTR. (n ≥ 4 biological experiments, where each dot represents the average ratio calculated from 10 measurements within a single cell). Statistical analysis: Dunnett’s One-Way ANOVA. AU = arbitrary unit. (c, d, e, f) Superoxide anion levels measured using the mitochondrial superoxide indicator MitoSOX in c. CTNS−/−#1 normalized to WT podocytes and protein content, d. CTNS−/−#2 normalized to WT podocytes and protein content, e. shCTNS#1 normalized to shCTR and protein content, f. shCTNS#2 normalized to shCTR and protein content. (n = 3 biological experiments, n ≥ 5 technical replicates) Statistical analysis: linear mixed model. Each dot represents a technical replicate. (g, h) Left panel: Representative western blot image of Superoxide Dismutase 2 (SOD2) in g. WT, CTNS−/−#1, and CTNS−/−#2, and h. shCTR, shCTNS#1, and shCTNS#2. β-Actin was used as a loading control. Right panel: Quantification of SOD2 protein expression relative to β-Actin. (n = 4 biological experiments, n = 1 technical replicate). Statistical analysis: one-sample t-test, with WT set as the reference. AU = arbitrary units. (i, j, k, l) Ratio of the percentages of BODIPY-C11 + cells measured by flow cytometry in i. CTNS−/−#1 normalized to WT, j. CTNS−/−#2 normalized to WT, k. shCTNS#1 normalized to shCTR, and l. shCTNS#2 normalized to shCTR. (n ≥ 4 biological experiments, n = 1 technical replicate). Statistical analysis: Welch’s unpaired t-test. Unless noted, each dot represents a biological experiment |
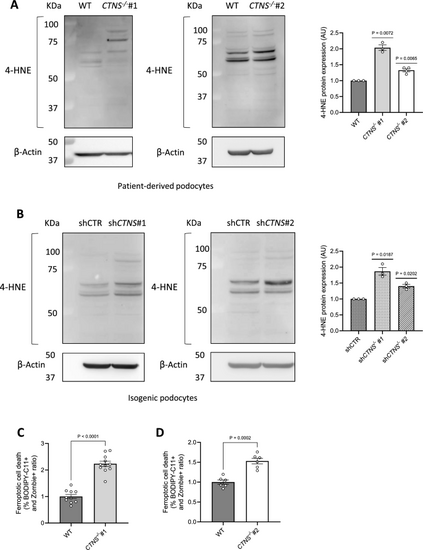
Cystinosis podocytes present increased 4-hydroxynonenal (4-HNE) protein expression and ferroptotic cell death. (a, b) Representative western blot analysis of 4-hydroxynonenal (4-HNE)-conjugated protein levels. a. Left panel: WT and CTNS−/−#1; central panel: WT and CTNS−/−#2, with β-Actin used as the loading control. Right panel: quantification of 4-HNE protein expression normalized to β-Actin. (n ≥ 3 biological experiments, n = 1 technical replicate). Statistical analysis: one-sample t-test, with WT set as the reference. b. Left panel: shCTR and shCTNS#1; central panel: shCTR and shCTNS#2, with β-Actin used as loading control. Right panel: quantification of 4-HNE protein expression normalized to β-Actin. (n = 3 biological experiments, n = 1 technical replicate). Statistical analysis: one-sample t-test, with shCTR set as the reference. (c, d) Ratio of the percentages of BODIPY-C11 + cells among dead podocytes (Zombie) measured by flow cytometry. c. CTNS−/−#1 normalized to WT; d. CTNS−/−#2 normalized to WT. (n ≥ 3 biological experiments, n = 1 technical replicate). Statistical analysis: Welch’s unpaired t-test Each dot represents a biological experiment |
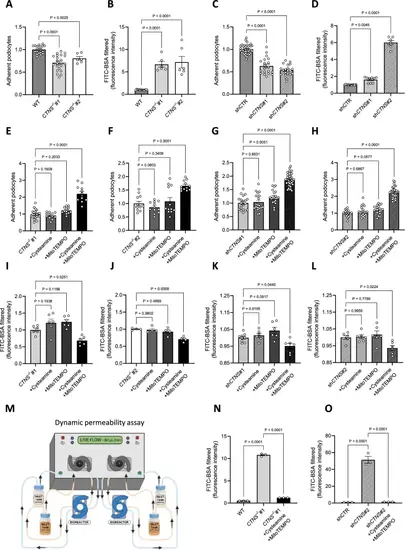
Targeting mitochondrial ROS improves cell adhesion and reduces podocyte permeability. (a) Adherence of CTNS−/−#1 and CTNS−/−#2, normalized to WT podocytes. Each dot represents the relative number of podocytes attached in one well. (n ≥ 3 biological experiments, n ≥ 3 technical replicates). Statistical analysis: linear mixed model. (b) Fluorescein isothiocyanate-labeled bovine serum albumin (FITC-BSA) fluorescence quantification in CTNS−/−#1 and CTNS−/−#2, normalized to WT. (n ≥ 6 biological experiments, n = 4 technical replicates). Statistical analysis: Dunnett’s One-Way ANOVA. (c) Adherence of shCTNS#1 and shCTNS#2, normalized to shCTR. Each dot represents the relative number of podocytes attached in one well. (n ≥ 3 biological experiments, n ≥ 3 technical replicates). Statistical analysis: linear mixed model. (d) FITC-BSA fluorescence quantification in shCTNS#1 and shCTNS#2, normalized to shCTR. (n ≥ 7 biological experiments, n = 4 technical replicates. Statistical analysis: Dunn’s Kruskal–Wallis. (e, f, g, h) Adherence of cells incubated with 100 µM cysteamine, 10 µM MitoTEMPO, or 100 µM cysteamine + 10 µM MitoTEMPO for 48 h, normalized to e. CTNS−/−#1, f. CTNS−/−#2, g. shCTNS#1, and h. shCTNS#2. (n ≥ 3 biological experiments, n ≥ 3 technical replicates). Statistical analysis: linear mixed model. (I, j, k, l) FITC-BSA fluorescence quantification of cells incubated with 100 µM cysteamine, 10 µM MitoTEMPO, or 100 µM cysteamine + 10 µM MitoTEMPO for 48 h, normalized to i. CTNS−/−#1, j. CTNS−/−#2, k. shCTNS#1, and l. shCTNS#2. (n ≥ 4 biological experiments, n ≥ 3 technical replicates). Statistical analysis: Dunnett’s One-Way ANOVA. (m) Millifluidic system to assess podocyte dynamic permeability. Podocytes were seeded in a bioreactor and perfused with media. The figure was created using biorender.com. (n, o) Quantification of FITC-BSA fluorescence intensity in the upper chamber medium after perfusion in n. WT, CTNS−/−#1 + 100 µM cysteamine + 10 µM MitoTEMPO, and o. shCTR, shCTNS#2 + 100 µM cysteamine + 10 µM MitoTEMPO for 48 h. (n ≥ 3 biological experiments, n = 4 technical replicates). Statistical analysis: Dunnett’s One-Way ANOVA. Unless noted, each dot represents a biological experiment |
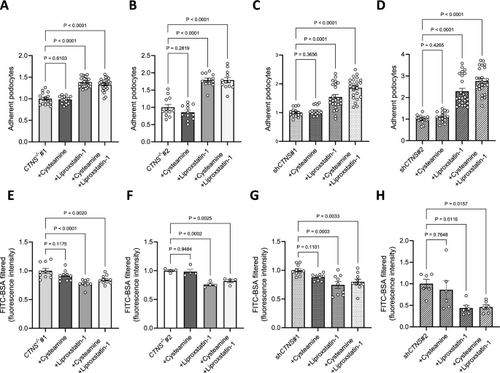
Inhibiting lipid peroxidation improves cell adhesion and reduces podocyte permeability. (a, b, c, d) Adherence of cells incubated with 100 µM cysteamine, 10 µM liproxstatin-1, or 100 µM cysteamine + 10 µM liproxstatin-1 for 48 h, normalized to a. CTNS−/−#1, b. CTNS−/−#2, c. shCTNS#1, and d. shCTNS#2. Each dot represents the relative number of podocytes attached in one well. (n ≥ 3 biological experiments, n ≥ 3 technical replicates). Statistical analysis: linear mixed model. (e, f, g, h) FITC-BSA fluorescence quantification of cells incubated with 100 µM cysteamine, 10 µM liproxstatin-1, or 100 µM cysteamine + 10 µM liproxstatin-1 for 48 h, normalized to e. CTNS−/−#1, f. CTNS−/−#2, g. shCTNS#1, and h. shCTNS#2. (n ≥ 4 biological experiments, n = 4 technical replicates). Statistical analysis: Dunnett’s One-Way ANOVA. Unless noted, each dot represents a biological experiment |
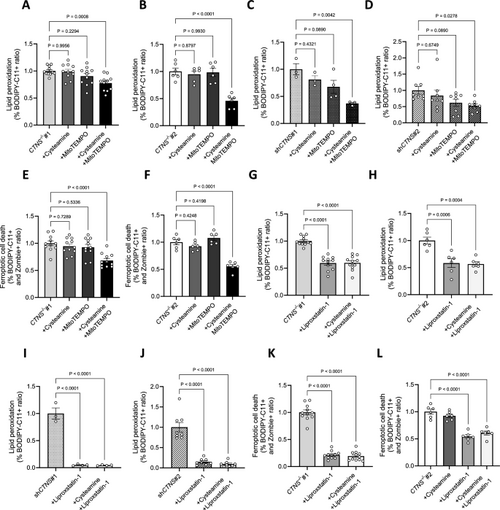
Mitochondrial oxidative stress induces lipid peroxidation in cystinosis podocytes. (a, b, c, d) Ratio of the percentages of BODIPY-C11 + cells measured by flow cytometry incubated with 10 µM cysteamine, 10 µM MitoTEMPO, or 100 µM cysteamine + 10 µM MitoTEMPO for 48 h, normalized to a. CTNS−/−#1, b. CTNS−/−#2, c. shCTNS#1, and d. shCTNS#2. (n ≥ 3 biological experiments, n = 1 technical replicate). Statistical analysis: Dunnett’s One-Way ANOVA. (e, f) Ratio of the percentages of BODIPY-C11 + cells among dead podocytes (Zombie) measured by flow cytometry incubated with 100 µM cysteamine, 10 µM MitoTEMPO, or 100 µM cysteamine + 10 µM MitoTEMPO for 48 h, normalized to e. CTNS−/−#1 and f. CTNS−/−#2. (n ≥ 3 biological experiments, n = 1 technical replicate). Statistical analysis: Dunnett’s One-Way ANOVA. (g, h, i, j) Ratio of the percentages of BODIPY-C11 + cells measured by flow cytometry incubated with 10 µM liproxstatin-1 or 100 µM cysteamine + 10 µM liproxstatin-1 for 48 h, normalized to g. CTNS−/−#1, h. CTNS−/−#2, i. shCTNS#1, and j. shCTNS#2. Data for the CTNS−/−#1, CTNS−/−#2, shCTNS#1, and shCTNS#2 groups are the same as those in (A-D), respectively. (n ≥ 3 biological experiments, n = 1 technical replicate). Statistical analysis: Dunnett’s One-Way ANOVA. (k, l) Ratio of the percentages of BODIPY-C11 + cells among dead podocytes (Zombie) measured by flow cytometry incubated with 10 µM liproxstatin-1 or 100 µM cysteamine + 10 µM liproxstatin-1 for 48 h, normalized to k. CTNS−/−#1 and l. CTNS−/−#2. Data for the CTNS−/−#1 and CTNS−/−#2 groups are the same as those in (e–f), respectively. (n ≥ 3 biological experiments, n = 1 technical replicate). Statistical analysis: Dunnett’s One-Way ANOVA. Each dot represents a biological experiment |
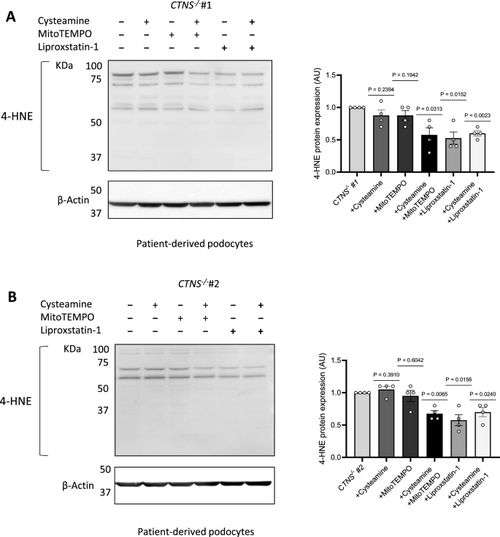
Combinatorial treatment with cysteamine and MitoTEMPO or liproxstatin-1 decreases 4-HNE protein expression in cystinosis podocytes. (a, b) Left panel: Representative western blot image of 4-hydroxynonenal (4-HNE)-conjugated protein levels in a. CTNS−/−#1 and b. CTNS−/−#2 treated with 100 µM cysteamine, 10 µM MitoTEMPO, 100 µM cysteamine + 10 µM MitoTEMPO, 10 µM liproxstatin-1, or 100 µM cysteamine + 10 µM liproxstatin-1 for 48 h. β-Actin was used as a loading control. Right panel: Quantification of 4-HNE protein expression normalized to β-Actin. (n = 4 biological experiments, n = 1 technical replicate) Statistical analysis: one-sample t-test, with WT set as the reference. AU = arbitrary units. Each dot represents a biological experiment |
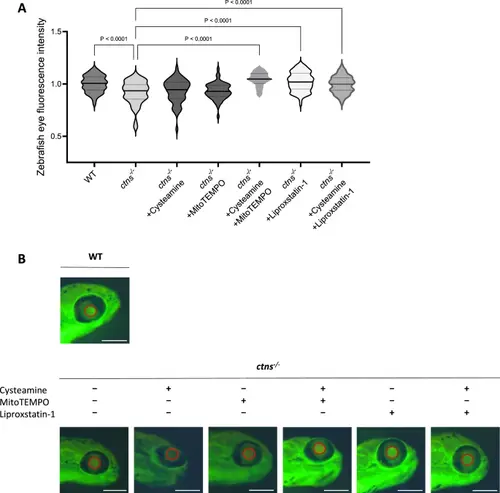
Scavenging mitochondrial oxidative stress and inhibiting lipid peroxidation rescues proteinuria in DBP-EGFP cystinosis zebrafish larvae. a. Quantification of DBP-EGFP fluorescence intensity in the eyes of 120 h post-fertilization (hpf) zebrafish larvae. Data include WT (ctns+/+), ctns−/−, and ctns−/− larvae treated from 48 to 120 hpf with 100 µM cysteamine, 100 µM cysteamine + 10 µM MitoTEMPO, 10 µM liproxstatin-1, or 100 µM cysteamine + 10 µM liproxstatin-1. n ≥ 60 zebrafish larvae per condition. Statistical analysis: Šídák's One-Way ANOVA. Fluorescence intensity is normalized to WT and presented as a violin plot. b. Representative images of 120 hpf zebrafish larvae eyes for WT, ctns−/−, and ctns−/− treated with 100 µM cysteamine, 10 µM MitoTEMPO, 100 µM cysteamine + 10 µM MitoTEMPO, 10 µM liproxstatin-1, or 100 µM cysteamine + 10 µM liproxstatin-1. Red circles highlight areas where DBP-EGFP fluorescence intensity was measured. Scale bar: 250 µm |