FIGURE SUMMARY
Title

Mcm5 mutation leads to silencing of Stat1-bcl2 which accelerating apoptosis of immature T lymphocytes with DNA damage

Authors
Liu, M., Li, Y., Deng, Z., Zhang, K., Huang, S., Xia, J., Feng, Y., Liang, Y., Sun, C., Liu, X., Li, S., Su, B., Dong, Y., Huang, S.
Source
Full text @ Cell Death Dis.

Mcm5 regulates T lymphocyte maturation during hematopoiesis.

A In control sibling embryos, the expression of rag1, rag2, il7r and ikaros was examined at 5 dpf (shown in the upper-row images). In mcm5−/− embryos, the expression of rag1(n = 29), rag2 (n = 31), il7r (n = 19) and ikaros (n = 20) completely disappeared at 5 dpf (shown in the bottom-row images). BGH1 is a pituitary maker, here working as a control. Comparing to siblings (n = 30), the expression of GH1 in mcm5 mutants was normal (n = 27). C The cells labeled with DsRed (in Tg(rag2:DsRed)) disappeared in mcm5−/− embryos at 5 dpf (n = 27). D Expression of rag2 was greatly decreased in mcm5−/− embryos at 4 dpf (D, n = 27). The expression of GH1 was normal in mcm5−/−embryos at 4 dpf (D, n = 21). E Quantification of the expression area of rag2 in siblings and mcm5−/− embryos at 3.5 dpf and 4 dpf was showed. F The expression of rag1 in mcm5−/− embryos was significantly downregulated at 4 dpf in the thymus (n = 30). Mcm5 mRNA injection restored the expression of rag1 in mcm5−/− embryos (n = 28). G The quantification of the expression area of rag1 at 4 dpf is showed. For (E,G), the data were presented as means ± SD; The P-values (t-test; two-tailed); Ns not significant; *** P < 0.001.

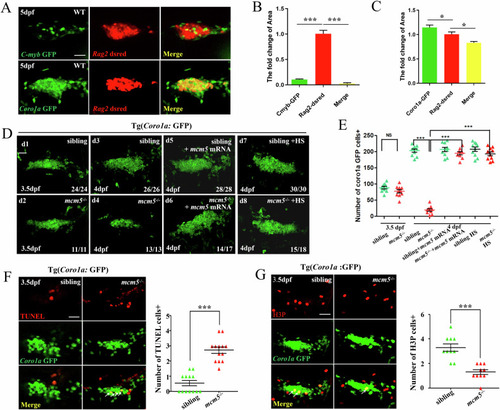
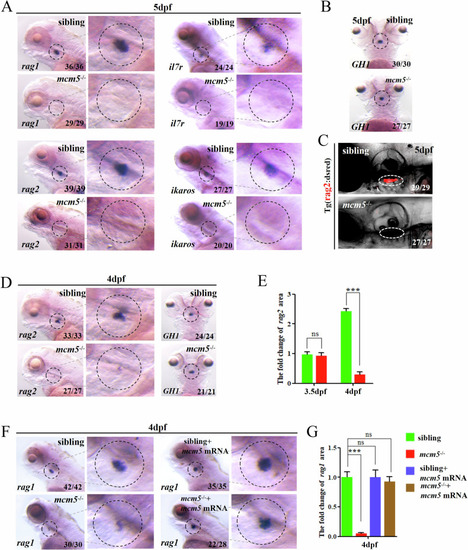
Immature T lymphocytes undergo cell death in mcm5−/− embryos.

AC Analysis of the expression of Rag2:DsRed, C-myb:GFP and Coro1a:GFP at 5 dpf. The expression of C-myb:GFP almost did not overlap with Rag2:DsRed expression (A, B, yellow column, n = 3, 3%), and most Rag2:DsRed-positive cells overlapped with cells labeled with Coro1a:GFP (A, C, yellow column, n = 3, 82.4%). D, E No significant difference was observed for Coro1a:GFP cells in siblings (d1, n = 24) and mcm5−/− embryos (d2, n = 11) at 3.5 dpf (d1-d2, E; n = 11), but at 4 dpf, the number of Coro1a:GFP cells was greatly decreased (d3-d4, E; n = 13). This phenotype can be rescued by injecting mcm5 mRNA at the 1- to 4-cell stage (d5-d6, E; n = 17) or heat shock-inducing mcm5 expression at 3 dpf (d7-d8, E; n = 18). Here we counted the Coro1a:GFP labeled cells in each single slice, then added them together as the whole T cell number. F TUNEL-positive Coro1a:GFP cells were increased in mcm5−/− embryos (n = 13) compared with their siblings (n = 13). G There were fewer H3P-positive Coro1a:GFP cells in mcm5−/− embryos (n = 10). Here H3P is a mitotic marker Histone H3 phosphorylated at Serine 10. Scale bars, 40 μm. Statistical analyses of the expression of Coro1a:GFP are shown on the right. For (B, C, EG), the data were presented as means ± SD; The P-values (t-test; two-tailed); NS, not significant. “***” P < 0.001.

p53-dependentproapoptotic signaling mediates the death of immature T lymphocytes.
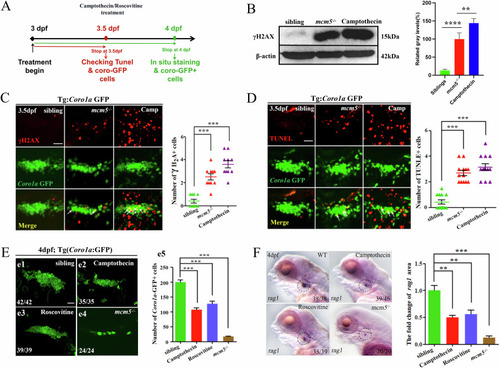
A Comparison of the expression of critical p53 signaling genes and cell cycle genes. B Relative expression of tp53, the tp53 downstream genes 113p53, mdm2 and p21, puma, bax, bik and the cell cycle gene ccng1. Besides the expression of tp53, all of the genes were upregulated in mcm5−/− embryos. As shown by RT‒qPCR, the experiments were repeated at least 3 times, and the value was normalized to that of β-actin. C The expression of tp53 was evaluated by WISH and Western blotting for siblings, mcm5−/− embryos and siblings treated with heat-shock. The right columns show the relative gray level for Western blotting. The mRNA level of tp53 was not upregulated in mcm5−/− embryos, but the protein level was greatly increased. D TUNEL staining was evaluated for Coro1a:GFP-labeled cells at 3.5 dpf in siblings (n = 7), mcm5−/− (n = 7) and mcm5−/− embryos injected with p53MO (n = 7). E On 4 dpf, the number of Coro1a: GFP-labeled cells in siblings (e1, n = 38), mcm5−/−embryos (e2, n = 29), embryos injected with p53 MO (e3, n = 34) and mcm5−/−embryos injected with p53 MO (e4, n = 24) was examined. The number of Coro1a: GFP-labeled cells in mcm5−/−embryos was partially restored by injecting p53MO (e5). F The expression of rag2 was examined in siblings (f1, n = 20), mcm5−/−embryos (f2, n = 15), embryos injected with p53 MO (f3, n = 17) and mcm5−/−embryos injected with p53 MO (f4, n = 13). The expression of rag2 in mcm5−/−embryos was partially restored by injecting p53MO (f4-f5). Scale bars, 40 μm. For (B, C), e5 and f5, the data were presented as means ± SD; The P-values (t-test; two-tailed); NS, not significant. “*” P < 0.05, “**” P < 0.01, “***” P < 0.001.

Immature T cells in mcm5 mutants are more sensitive to DNA damage.

A Schematic for chemical treatment and subsequent examination. B γH2AX protein was evaluated by Western blotting. The right columns show the relative gray level. C γ-H2AX is a phosphorylated form of H2AX, which is a DNA damage marker. DNA damage was evaluated by γH2AX immunostaining for siblings (n = 10), mcm5−/− embryos (n = 10) and siblings treated with camptothecin (n = 10). D Proapoptotic Coro1a:GFP cells were examined using TUNEL staining for embryos with different treatments at 3.5 dpf. More TUNEL-positive Coro1a:GFP cells were observed in embryos treated with camptothecin. E On 4 dpf, the expression of Coro1a:GFP in the thymus was compared among siblings (e1, n = 42), embryos treated with camptothecin (e2, n = 35) or roscovitine (e3, n = 39), and mcm5−/− embryos (e4, n = 24). The number of Coro1a:GFP labeled cells was decreased in embryos treated with camptothecin or roscovitine, but the phenotype was not as strong as that in mcm5−/− embryos (e5). F Expression of rag1 in embryos with different treatments. Embryos treated with camptothecin (45% of WT controls) or roscovitine (56% of WT controls) displayed decreased expression of rag1, but the decrease was not as strong as that in mcm5−/− embryos (10.7% of controls). For (BF), the data were presented as means ± SD; The P-values (t-test; two-tailed); NS, not significant. “**” P < 0.01, “***” P < 0.001.

Silencing of bcl2a in mcm5 mutants accelerates the death of immature T lymphocytes.

A Upregulation of Δ113p53 expression in mcm5-/ -embryos and embryos treated with camptothecin was confirmed using in situ experiments. B RT‒qPCR examination showed that the expression of Δ113p53 was upregulated in thymus region of mcm5−/− embryos and embryos treated with camptothecin. C The expression of rag1 in controls (c1, n = 27), Δ113p53−/− embryos (c3, n = 27) and embryos injected with Δ113p53 mRNA (c4, n = 28) was normal (c7). Downregulation of rag1 expression in mcm5−/−embryos (c2, n = 21) was partially reversed by injection of Δ113p53 mRNA (c5, n = 19; c7) and was exacerbated in mcm5−/−;Δ113p53−/−double mutants (c6, n = 18; c7). D, E The expression of bcl2a in different embryos was assessed using WISH (D) and RT‒qPCR (E). F At the protein level, Bcl2 was upregulated in embryos treated with camptothecin but not in mcm5−/− embryos. G In the transgenic line Tg(coro1a:GFP), compared to that in siblings (g1, n = 25), mcm5−/− embryos (g4, n = 13) and embryos injected with Δ113p53 mRNA (g2, n = 30), the decrease in coro1a:GFP cells in mcm5−/− embryos was partially rescued by injection of Δ113p53 mRNA (g5, n = 12). Overexpression of bcl2a mRNA did not affected the number of Coro1a:GFP labeled cells (g3, n = 32), but also partially reversed the T-cell developmental defect in mcm5−/−embryos (g6, n = 13). H Compared to that in siblings (h1, n = 27), mcm5−/− embryos (h2, n = 9), the expression of rag1 was partially rescued by injection of bcl2 mRNA in mcm5−/− embryos (h3, n = 12; h4). Scale bars, 40 μm. For (B, c7, E and f4), the data were presented as means ± SD; The P-values (t-test; two-tailed); NS not significant. “**” P < 0.01, “***”P < 0.001.

The MCM5/stat1 complex is required for Stat1 phosphorylation and downstream gene bcl2a transcription.

A The proteins Stat1 and p-Stat1 were evaluated in siblings and mcm5−/− embryos at 3.5 dpf. p-Stat1 but not Stat1 was downregulated in mcm5−/− embryos. B The expression of bcl2a in embryos with different treatments. The data showed that stat1a MO injection further downregulated bcl2a expression in mcm5 mutants, and stat1a MO injection also decreased bcl2a expression in embryos treated with camptothecin. C In situ staining for the rag1 probe in embryos. stat1a MO injection further decreased the expression of rag1 in mcm5 mutants (c2, n = 9). Compared to controls (c1, n = 33), embryos injected with stat1a MO displayed decreased expression of rag1 (c3, c4, n = 27). Compared to controls (c5, n = 29), stat1a MO injection led to a more severe decrease in rag1 expression when camptothecin treatment was applied (c6, c7, n = 38). D Quantification of the area of rag1 expression in different kinds of embryos. E The expression of rag2 in the thymus. Compared to controls (e1, n = 35), the expression of rag2 was decreased in embryos injected with stat1a MO (e2, e3, n = 27). Injection of bcl2a mRNA rescued the expression of rag2 in WT embryos injected with Stat1a MO (e4, n = 31). The DsRed-labeled T cells were examined in different kind of embryos (e5-e8). Compared to controls (e5, n = 30), the expression of DsRed in thymus was decreased in embryos injected with stat1a MO (e6, e7, n = 30). The expression of DsRed in stat1a morphants was also rescued by injecting bcl2a mRNA (e8, n = 29). F Quantification of the expression of rag2 in e1 to e4. G Examination of the interaction of zebrafish MCM5 and zebrafish Stat1a using a Co-IP experiment. In first lane, IgG was used as negative control to carry out IP experiment, anti-Flag was used to examine the interation between Stat1 and MCM5, anti-HA was used to perform west blotting staining. The staining showed that MCM5 binds to Stat1a. H The expression of rag1 in the thymus was greatly downregulated in mcm3−/− embryos but not as strongly as that in mcm5−/− embryos. I The expression of bcl2a in siblings and mcm3−/− embryos was examined using WISH, WB and RT‒qPCR. For (A, D, F, H, I), the data were presented as means ± SD; The P-values (t-test; two-tailed); NS not significant. “*”P < 0.05, “**”P < 0.01, “***”P < 0.001.

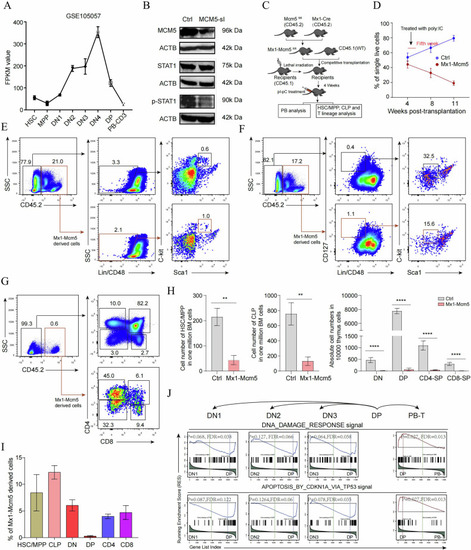
CD4+CD8+ DP cells are most sensitive to Mcm5 knockout.

A Expression levels of mouse Mcm5 in different stages of T differentiation. The data are derived from GSE105057. B The expression level of Stat1 and p-Stat1 in 293 T cells before and after Mcm5 was knocked down. When Mcm5 was knocked down, the level of p-Stat1 but not Stat1 was decreased. C Experimental flowchart of the analysis of the impact of Mcm5 knockout on T lineage differentiation. D Statistical analysis of Mcm5−/− and WT-derived contributions in the PB of recipients. The ratio of Mcm5−/− derived PB decreased at 8 and 11 weeks post-transplantation. EG Flow cytometry analysis of hematopoietic stem cells/multipotential progenitors (HSCs/MPPs) (E), common lymphocyte progenitors (CLPs) (F), CD4-CD8- double-negative (DN) T progenitors, CD4+CD8+ double-positive (DP) T progenitors, CD4+CD8- and CD4-CD8+ single-positive T cells (G) in wild type control cells (CD45.1) and Mcm5−/− derived cells (CD45.2). H Cell number of HSCs/MPPs, CLPS and different kinds of T cells in one million analyzed cells. Compared to wild type control cells (CD45.1), all kinds of Mcm5−/− derived cells (CD45.2) are greatly decreased. I Compared to wild type controls, statistical analysis of the ratio of Mcm5−/−derived HSCs/MPPs, CLPs, DN T progenitors, DP T progenitors, and CD4+CD8- and CD4-CD8+ single-positive T cells in the bone marrow and thymus of recipients. J Gene set enrichment analysis (GSEA) of the DNA damage response and apoptosis-related signals in DN1-, DN2-, DN3-, DP- and PB-derived mature CD3+ T cells. The transcriptome data were derived from GSE105057. The data are representative of two independent experiments (EG) or are pooled from two independent experiments (H, I; mean ± SD of n = 4 biological replicates). The data in (A, D, H, I) are presented as the means ± SDs. NS not significant. “*” P < 0.05, “**” P < 0.01, “***” P < 0.001, “****” P < 0.0001.

Acknowledgments
This image is the copyrighted work of the attributed author or publisher, and ZFIN has permission only to display this image to its users. Additional permissions should be obtained from the applicable author or publisher of the image. Full text @ Cell Death Dis.