|
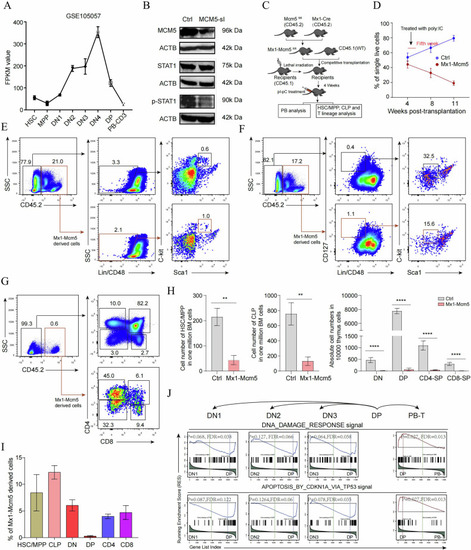
CD4+CD8+ DP cells are most sensitive to Mcm5 knockout. A Expression levels of mouse Mcm5 in different stages of T differentiation. The data are derived from GSE105057. B The expression level of Stat1 and p-Stat1 in 293 T cells before and after Mcm5 was knocked down. When Mcm5 was knocked down, the level of p-Stat1 but not Stat1 was decreased. C Experimental flowchart of the analysis of the impact of Mcm5 knockout on T lineage differentiation. D Statistical analysis of Mcm5−/− and WT-derived contributions in the PB of recipients. The ratio of Mcm5−/− derived PB decreased at 8 and 11 weeks post-transplantation. E–G Flow cytometry analysis of hematopoietic stem cells/multipotential progenitors (HSCs/MPPs) (E), common lymphocyte progenitors (CLPs) (F), CD4-CD8- double-negative (DN) T progenitors, CD4+CD8+ double-positive (DP) T progenitors, CD4+CD8- and CD4-CD8+ single-positive T cells (G) in wild type control cells (CD45.1) and Mcm5−/− derived cells (CD45.2). H Cell number of HSCs/MPPs, CLPS and different kinds of T cells in one million analyzed cells. Compared to wild type control cells (CD45.1), all kinds of Mcm5−/− derived cells (CD45.2) are greatly decreased. I Compared to wild type controls, statistical analysis of the ratio of Mcm5−/−derived HSCs/MPPs, CLPs, DN T progenitors, DP T progenitors, and CD4+CD8- and CD4-CD8+ single-positive T cells in the bone marrow and thymus of recipients. J Gene set enrichment analysis (GSEA) of the DNA damage response and apoptosis-related signals in DN1-, DN2-, DN3-, DP- and PB-derived mature CD3+ T cells. The transcriptome data were derived from GSE105057. The data are representative of two independent experiments (E–G) or are pooled from two independent experiments (H, I; mean ± SD of n = 4 biological replicates). The data in (A, D, H, I) are presented as the means ± SDs. NS not significant. “*” P < 0.05, “**” P < 0.01, “***” P < 0.001, “****” P < 0.0001.
|